Immigrants from Nepal vs Ugandan Child Poverty Among Girls Under 16
COMPARE
Immigrants from Nepal
Ugandan
Child Poverty Among Girls Under 16
Child Poverty Among Girls Under 16 Comparison
Immigrants from Nepal
Ugandans
15.9%
CHILD POVERTY AMONG GIRLS UNDER 16
78.5/ 100
METRIC RATING
153rd/ 347
METRIC RANK
17.2%
CHILD POVERTY AMONG GIRLS UNDER 16
17.5/ 100
METRIC RATING
203rd/ 347
METRIC RANK
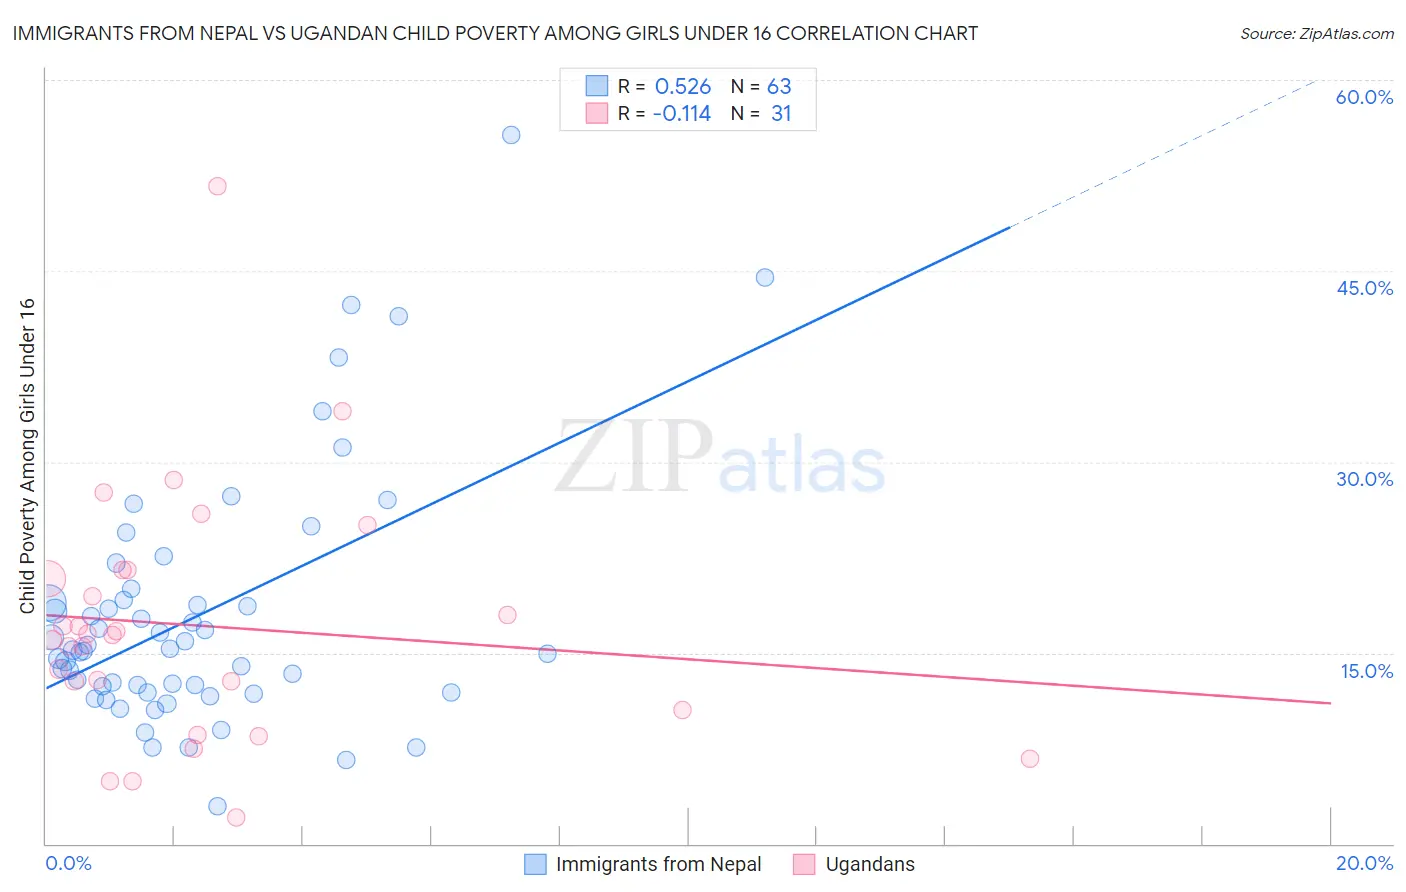
Immigrants from Nepal vs Ugandan Child Poverty Among Girls Under 16 Correlation Chart
The statistical analysis conducted on geographies consisting of 185,239,456 people shows a substantial positive correlation between the proportion of Immigrants from Nepal and poverty level among girls under the age of 16 in the United States with a correlation coefficient (R) of 0.526 and weighted average of 15.9%. Similarly, the statistical analysis conducted on geographies consisting of 93,523,032 people shows a poor negative correlation between the proportion of Ugandans and poverty level among girls under the age of 16 in the United States with a correlation coefficient (R) of -0.114 and weighted average of 17.2%, a difference of 8.5%.
Child Poverty Among Girls Under 16 Correlation Summary
| Measurement | Immigrants from Nepal | Ugandan |
| Minimum | 3.0% | 2.1% |
| Maximum | 55.7% | 51.6% |
| Range | 52.7% | 49.5% |
| Mean | 18.0% | 17.1% |
| Median | 15.2% | 16.4% |
| Interquartile 25% (IQ1) | 11.9% | 10.5% |
| Interquartile 75% (IQ3) | 19.1% | 21.5% |
| Interquartile Range (IQR) | 7.2% | 10.9% |
| Standard Deviation (Sample) | 9.9% | 9.8% |
| Standard Deviation (Population) | 9.8% | 9.7% |
Similar Demographics by Child Poverty Among Girls Under 16
Demographics Similar to Immigrants from Nepal by Child Poverty Among Girls Under 16
In terms of child poverty among girls under 16, the demographic groups most similar to Immigrants from Nepal are Immigrants from Kuwait (15.8%, a difference of 0.15%), Venezuelan (15.8%, a difference of 0.29%), Immigrants from Chile (15.9%, a difference of 0.31%), Syrian (15.9%, a difference of 0.32%), and Immigrants from Albania (15.8%, a difference of 0.40%).
| Demographics | Rating | Rank | Child Poverty Among Girls Under 16 |
| Samoans | 84.2 /100 | #146 | Excellent 15.7% |
| Slavs | 83.1 /100 | #147 | Excellent 15.7% |
| Icelanders | 82.4 /100 | #148 | Excellent 15.7% |
| Immigrants | Hungary | 80.9 /100 | #149 | Excellent 15.8% |
| Immigrants | Albania | 80.7 /100 | #150 | Excellent 15.8% |
| Venezuelans | 80.1 /100 | #151 | Excellent 15.8% |
| Immigrants | Kuwait | 79.4 /100 | #152 | Good 15.8% |
| Immigrants | Nepal | 78.5 /100 | #153 | Good 15.9% |
| Immigrants | Chile | 76.7 /100 | #154 | Good 15.9% |
| Syrians | 76.7 /100 | #155 | Good 15.9% |
| Immigrants | Fiji | 76.1 /100 | #156 | Good 15.9% |
| Colombians | 76.1 /100 | #157 | Good 15.9% |
| Guamanians/Chamorros | 75.3 /100 | #158 | Good 15.9% |
| Slovaks | 75.2 /100 | #159 | Good 15.9% |
| French | 72.8 /100 | #160 | Good 16.0% |
Demographics Similar to Ugandans by Child Poverty Among Girls Under 16
In terms of child poverty among girls under 16, the demographic groups most similar to Ugandans are Immigrants from Sierra Leone (17.2%, a difference of 0.010%), Immigrants from Kenya (17.2%, a difference of 0.060%), Immigrants from Uzbekistan (17.1%, a difference of 0.70%), Immigrants from Afghanistan (17.1%, a difference of 0.85%), and Immigrants from Lebanon (17.1%, a difference of 0.88%).
| Demographics | Rating | Rank | Child Poverty Among Girls Under 16 |
| Celtics | 25.2 /100 | #196 | Fair 17.0% |
| Spaniards | 24.9 /100 | #197 | Fair 17.0% |
| Immigrants | Lebanon | 22.6 /100 | #198 | Fair 17.1% |
| Immigrants | Afghanistan | 22.4 /100 | #199 | Fair 17.1% |
| Immigrants | Uzbekistan | 21.5 /100 | #200 | Fair 17.1% |
| Immigrants | Kenya | 17.8 /100 | #201 | Poor 17.2% |
| Immigrants | Sierra Leone | 17.6 /100 | #202 | Poor 17.2% |
| Ugandans | 17.5 /100 | #203 | Poor 17.2% |
| Iraqis | 13.0 /100 | #204 | Poor 17.4% |
| Immigrants | Cameroon | 12.6 /100 | #205 | Poor 17.4% |
| Delaware | 11.5 /100 | #206 | Poor 17.4% |
| Hmong | 10.6 /100 | #207 | Poor 17.5% |
| Sierra Leoneans | 8.9 /100 | #208 | Tragic 17.6% |
| Panamanians | 8.7 /100 | #209 | Tragic 17.6% |
| Immigrants | Immigrants | 7.3 /100 | #210 | Tragic 17.7% |