Immigrants from Morocco vs Immigrants from Japan Seniors Poverty Over the Age of 75
COMPARE
Immigrants from Morocco
Immigrants from Japan
Seniors Poverty Over the Age of 75
Seniors Poverty Over the Age of 75 Comparison
Immigrants from Morocco
Immigrants from Japan
13.1%
SENIORS POVERTY OVER THE AGE OF 75
2.8/ 100
METRIC RATING
225th/ 347
METRIC RANK
11.6%
SENIORS POVERTY OVER THE AGE OF 75
91.9/ 100
METRIC RATING
98th/ 347
METRIC RANK
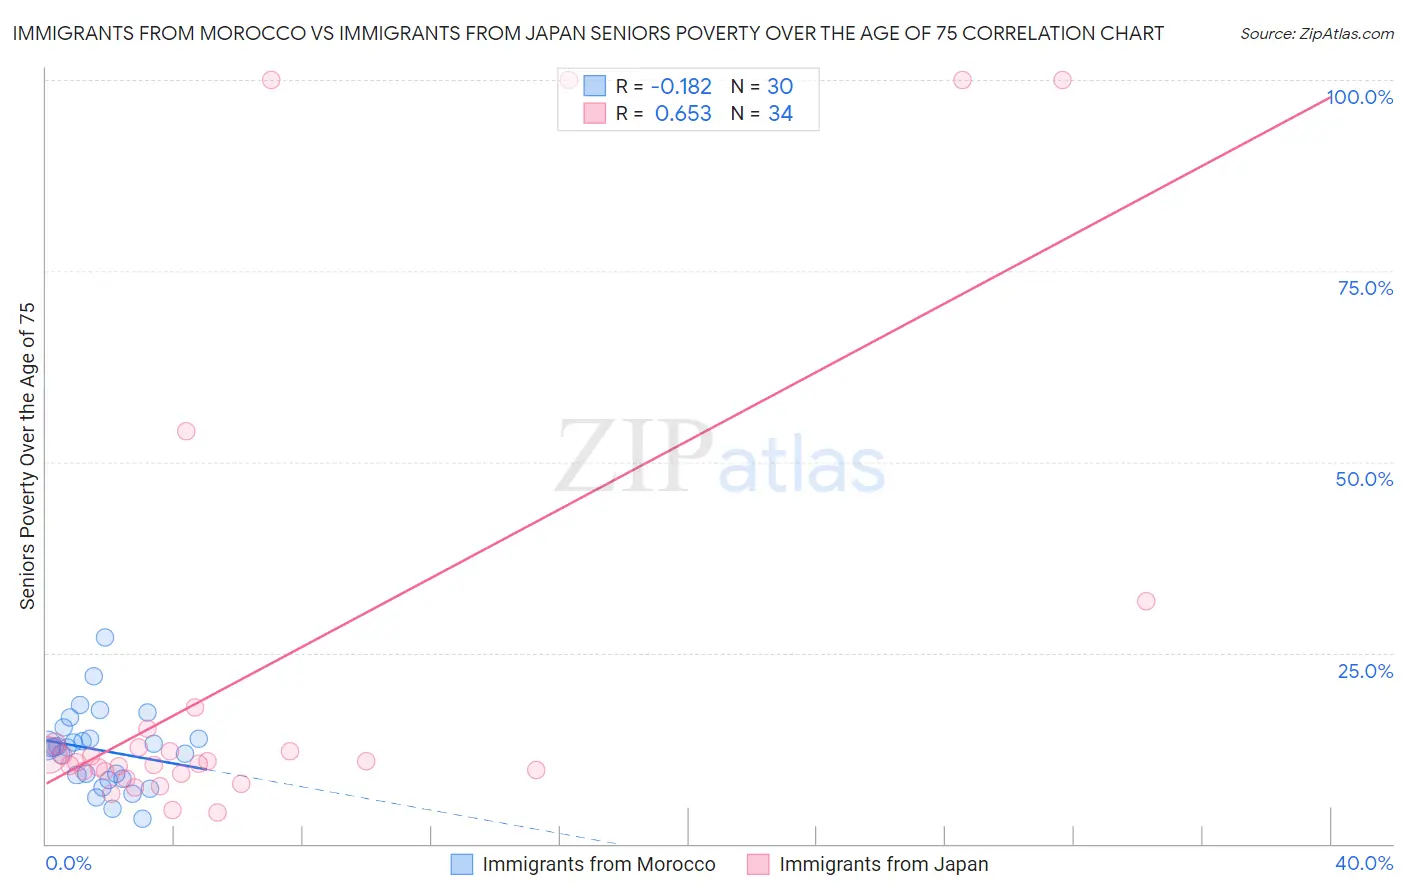
Immigrants from Morocco vs Immigrants from Japan Seniors Poverty Over the Age of 75 Correlation Chart
The statistical analysis conducted on geographies consisting of 178,230,696 people shows a poor negative correlation between the proportion of Immigrants from Morocco and poverty level among seniors over the age of 75 in the United States with a correlation coefficient (R) of -0.182 and weighted average of 13.1%. Similarly, the statistical analysis conducted on geographies consisting of 336,933,586 people shows a significant positive correlation between the proportion of Immigrants from Japan and poverty level among seniors over the age of 75 in the United States with a correlation coefficient (R) of 0.653 and weighted average of 11.6%, a difference of 12.7%.
Seniors Poverty Over the Age of 75 Correlation Summary
| Measurement | Immigrants from Morocco | Immigrants from Japan |
| Minimum | 3.2% | 4.0% |
| Maximum | 26.9% | 100.0% |
| Range | 23.7% | 96.0% |
| Mean | 12.2% | 22.7% |
| Median | 12.6% | 10.7% |
| Interquartile 25% (IQ1) | 8.4% | 9.4% |
| Interquartile 75% (IQ3) | 13.8% | 13.1% |
| Interquartile Range (IQR) | 5.4% | 3.7% |
| Standard Deviation (Sample) | 5.1% | 29.9% |
| Standard Deviation (Population) | 5.0% | 29.5% |
Similar Demographics by Seniors Poverty Over the Age of 75
Demographics Similar to Immigrants from Morocco by Seniors Poverty Over the Age of 75
In terms of seniors poverty over the age of 75, the demographic groups most similar to Immigrants from Morocco are Chippewa (13.1%, a difference of 0.070%), Shoshone (13.1%, a difference of 0.16%), Immigrants from Nigeria (13.0%, a difference of 0.27%), Nigerian (13.0%, a difference of 0.36%), and Cree (13.1%, a difference of 0.42%).
| Demographics | Rating | Rank | Seniors Poverty Over the Age of 75 |
| Immigrants | Western Asia | 4.9 /100 | #218 | Tragic 12.9% |
| Ute | 4.7 /100 | #219 | Tragic 12.9% |
| Seminole | 4.5 /100 | #220 | Tragic 12.9% |
| Immigrants | Kazakhstan | 4.3 /100 | #221 | Tragic 13.0% |
| Nigerians | 3.4 /100 | #222 | Tragic 13.0% |
| Immigrants | Nigeria | 3.3 /100 | #223 | Tragic 13.0% |
| Chippewa | 2.9 /100 | #224 | Tragic 13.1% |
| Immigrants | Morocco | 2.8 /100 | #225 | Tragic 13.1% |
| Shoshone | 2.6 /100 | #226 | Tragic 13.1% |
| Cree | 2.3 /100 | #227 | Tragic 13.1% |
| Israelis | 2.0 /100 | #228 | Tragic 13.2% |
| Somalis | 1.6 /100 | #229 | Tragic 13.2% |
| Immigrants | China | 1.5 /100 | #230 | Tragic 13.2% |
| Sub-Saharan Africans | 1.5 /100 | #231 | Tragic 13.2% |
| Immigrants | Chile | 1.3 /100 | #232 | Tragic 13.3% |
Demographics Similar to Immigrants from Japan by Seniors Poverty Over the Age of 75
In terms of seniors poverty over the age of 75, the demographic groups most similar to Immigrants from Japan are Immigrants from Ethiopia (11.6%, a difference of 0.070%), Romanian (11.6%, a difference of 0.11%), Immigrants from Bosnia and Herzegovina (11.6%, a difference of 0.20%), Immigrants from Sweden (11.6%, a difference of 0.20%), and Syrian (11.6%, a difference of 0.23%).
| Demographics | Rating | Rank | Seniors Poverty Over the Age of 75 |
| Immigrants | Germany | 94.1 /100 | #91 | Exceptional 11.5% |
| Kenyans | 93.9 /100 | #92 | Exceptional 11.5% |
| Immigrants | Poland | 92.9 /100 | #93 | Exceptional 11.6% |
| Creek | 92.7 /100 | #94 | Exceptional 11.6% |
| Immigrants | Bosnia and Herzegovina | 92.6 /100 | #95 | Exceptional 11.6% |
| Immigrants | Sweden | 92.6 /100 | #96 | Exceptional 11.6% |
| Romanians | 92.3 /100 | #97 | Exceptional 11.6% |
| Immigrants | Japan | 91.9 /100 | #98 | Exceptional 11.6% |
| Immigrants | Ethiopia | 91.7 /100 | #99 | Exceptional 11.6% |
| Syrians | 91.1 /100 | #100 | Exceptional 11.6% |
| Jordanians | 90.8 /100 | #101 | Exceptional 11.6% |
| Guamanians/Chamorros | 90.6 /100 | #102 | Exceptional 11.6% |
| Immigrants | Kuwait | 90.5 /100 | #103 | Exceptional 11.6% |
| Immigrants | Singapore | 90.3 /100 | #104 | Exceptional 11.6% |
| Chickasaw | 90.2 /100 | #105 | Exceptional 11.6% |