Immigrants from Morocco vs Lebanese Seniors Poverty Over the Age of 75
COMPARE
Immigrants from Morocco
Lebanese
Seniors Poverty Over the Age of 75
Seniors Poverty Over the Age of 75 Comparison
Immigrants from Morocco
Lebanese
13.1%
SENIORS POVERTY OVER THE AGE OF 75
2.8/ 100
METRIC RATING
225th/ 347
METRIC RANK
11.9%
SENIORS POVERTY OVER THE AGE OF 75
78.3/ 100
METRIC RATING
132nd/ 347
METRIC RANK
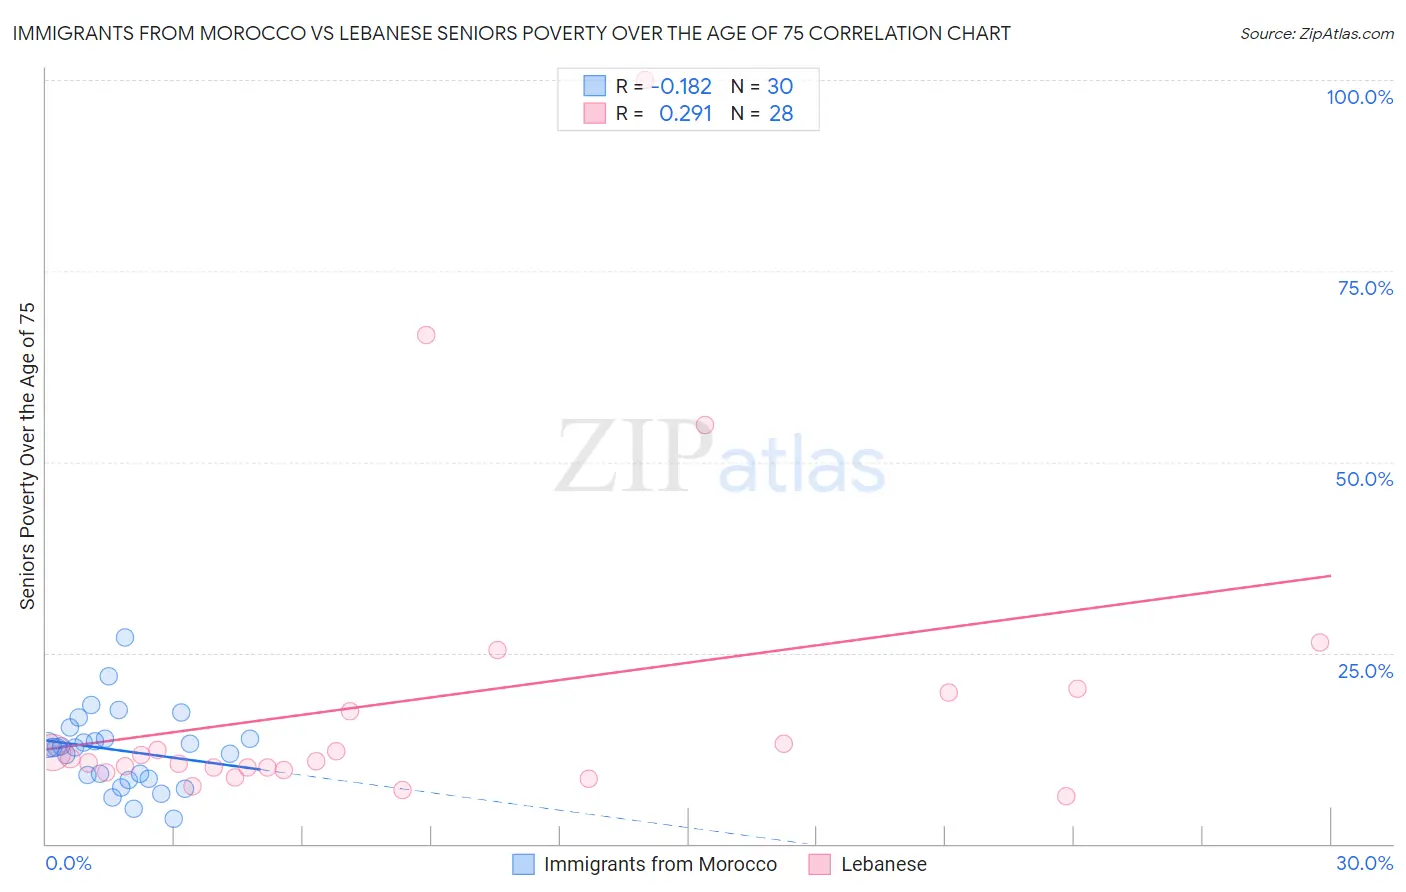
Immigrants from Morocco vs Lebanese Seniors Poverty Over the Age of 75 Correlation Chart
The statistical analysis conducted on geographies consisting of 178,230,696 people shows a poor negative correlation between the proportion of Immigrants from Morocco and poverty level among seniors over the age of 75 in the United States with a correlation coefficient (R) of -0.182 and weighted average of 13.1%. Similarly, the statistical analysis conducted on geographies consisting of 396,652,503 people shows a weak positive correlation between the proportion of Lebanese and poverty level among seniors over the age of 75 in the United States with a correlation coefficient (R) of 0.291 and weighted average of 11.9%, a difference of 10.0%.
Seniors Poverty Over the Age of 75 Correlation Summary
| Measurement | Immigrants from Morocco | Lebanese |
| Minimum | 3.2% | 6.2% |
| Maximum | 26.9% | 100.0% |
| Range | 23.7% | 93.8% |
| Mean | 12.2% | 19.0% |
| Median | 12.6% | 11.0% |
| Interquartile 25% (IQ1) | 8.4% | 9.8% |
| Interquartile 75% (IQ3) | 13.8% | 18.6% |
| Interquartile Range (IQR) | 5.4% | 8.8% |
| Standard Deviation (Sample) | 5.1% | 21.0% |
| Standard Deviation (Population) | 5.0% | 20.6% |
Similar Demographics by Seniors Poverty Over the Age of 75
Demographics Similar to Immigrants from Morocco by Seniors Poverty Over the Age of 75
In terms of seniors poverty over the age of 75, the demographic groups most similar to Immigrants from Morocco are Chippewa (13.1%, a difference of 0.070%), Shoshone (13.1%, a difference of 0.16%), Immigrants from Nigeria (13.0%, a difference of 0.27%), Nigerian (13.0%, a difference of 0.36%), and Cree (13.1%, a difference of 0.42%).
| Demographics | Rating | Rank | Seniors Poverty Over the Age of 75 |
| Immigrants | Western Asia | 4.9 /100 | #218 | Tragic 12.9% |
| Ute | 4.7 /100 | #219 | Tragic 12.9% |
| Seminole | 4.5 /100 | #220 | Tragic 12.9% |
| Immigrants | Kazakhstan | 4.3 /100 | #221 | Tragic 13.0% |
| Nigerians | 3.4 /100 | #222 | Tragic 13.0% |
| Immigrants | Nigeria | 3.3 /100 | #223 | Tragic 13.0% |
| Chippewa | 2.9 /100 | #224 | Tragic 13.1% |
| Immigrants | Morocco | 2.8 /100 | #225 | Tragic 13.1% |
| Shoshone | 2.6 /100 | #226 | Tragic 13.1% |
| Cree | 2.3 /100 | #227 | Tragic 13.1% |
| Israelis | 2.0 /100 | #228 | Tragic 13.2% |
| Somalis | 1.6 /100 | #229 | Tragic 13.2% |
| Immigrants | China | 1.5 /100 | #230 | Tragic 13.2% |
| Sub-Saharan Africans | 1.5 /100 | #231 | Tragic 13.2% |
| Immigrants | Chile | 1.3 /100 | #232 | Tragic 13.3% |
Demographics Similar to Lebanese by Seniors Poverty Over the Age of 75
In terms of seniors poverty over the age of 75, the demographic groups most similar to Lebanese are Immigrants from Sierra Leone (11.9%, a difference of 0.090%), Ugandan (11.9%, a difference of 0.15%), Immigrants from Western Europe (11.9%, a difference of 0.16%), Immigrants from Ireland (11.9%, a difference of 0.25%), and Spanish (11.8%, a difference of 0.28%).
| Demographics | Rating | Rank | Seniors Poverty Over the Age of 75 |
| Sudanese | 83.6 /100 | #125 | Excellent 11.8% |
| Pennsylvania Germans | 83.4 /100 | #126 | Excellent 11.8% |
| Immigrants | Denmark | 82.6 /100 | #127 | Excellent 11.8% |
| Immigrants | Hungary | 81.7 /100 | #128 | Excellent 11.8% |
| Ethiopians | 80.7 /100 | #129 | Excellent 11.8% |
| Spanish | 80.5 /100 | #130 | Excellent 11.8% |
| Immigrants | Western Europe | 79.6 /100 | #131 | Good 11.9% |
| Lebanese | 78.3 /100 | #132 | Good 11.9% |
| Immigrants | Sierra Leone | 77.6 /100 | #133 | Good 11.9% |
| Ugandans | 77.1 /100 | #134 | Good 11.9% |
| Immigrants | Ireland | 76.2 /100 | #135 | Good 11.9% |
| Immigrants | Philippines | 75.0 /100 | #136 | Good 11.9% |
| Immigrants | Moldova | 74.1 /100 | #137 | Good 11.9% |
| Immigrants | Romania | 72.6 /100 | #138 | Good 11.9% |
| Immigrants | Kenya | 72.6 /100 | #139 | Good 11.9% |