Immigrants from Lithuania vs Tsimshian Receiving Food Stamps

COMPARE

Immigrants from Lithuania
Race
Ancestry
AfghanAfricanAlaska NativeAlaskan AthabascanAlbanianAleutAlsatianAmericanApacheArabArapahoArgentineanArmenianAssyrian/Chaldean/SyriacAustralianAustrianBahamianBangladeshiBarbadianBasqueBelgianBelizeanBermudanBhutaneseBlackfeetBolivianBrazilianBritishBritish West IndianBulgarianBurmeseCajunCambodianCanadianCape VerdeanCarpatho RusynCelticCentral AmericanCentral American IndianCherokeeCheyenneChickasawChileanChineseChippewaChoctawColombianColvilleComancheCosta RicanCreeCreekCroatianCrowCubanCypriotCzechCzechoslovakianDanishDelawareDominicanDutchDutch West IndianEastern EuropeanEcuadorianEgyptianEnglishEstonianEthiopianEuropeanFijianFilipinoFinnishFrenchFrench American IndianFrench CanadianGermanGerman RussianGhanaianGreekGuamanian/ChamorroGuatemalanGuyaneseHaitianHmongHonduranHopiHoumaHungarianIcelanderIndian (Asian)IndonesianInupiatIranianIraqiIrishIroquoisIsraeliItalianJamaicanJapaneseJordanianKenyanKiowaKoreanLaotianLatvianLebaneseLiberianLithuanianLumbeeLuxembourgerMacedonianMalaysianMalteseMarshalleseMenomineeMexicanMexican American IndianMongolianMoroccanNative HawaiianNavajoNepaleseNew ZealanderNicaraguanNigerianNorthern EuropeanNorwegianOkinawanOsageOttawaPaiutePakistaniPalestinianPanamanianParaguayanPennsylvania GermanPeruvianPimaPolishPortuguesePotawatomiPuebloPuerto RicanPuget Sound SalishRomanianRussianSalvadoranSamoanScandinavianScotch-IrishScottishSeminoleSenegaleseSerbianShoshoneSierra LeoneanSiouxSlavicSlovakSloveneSomaliSouth AfricanSouth AmericanSouth American IndianSoviet UnionSpaniardSpanishSpanish AmericanSpanish American IndianSri LankanSubsaharan AfricanSudaneseSwedishSwissSyrianTaiwaneseThaiTlingit-HaidaTohono O'OdhamTonganTrinidadian and TobagonianTurkishU.S. Virgin IslanderUgandanUkrainianUruguayanUteVenezuelanVietnameseWelshWest IndianYakamaYaquiYugoslavianYumanYup'ikZimbabwean
Immigration
NonimmigrantsImmigrantsAfghanistanAfricaAlbaniaArgentinaArmeniaAsiaAustraliaAustriaBahamasBangladeshBarbadosBelarusBelgiumBelizeBoliviaBosnia and HerzegovinaBrazilBulgariaBurma/MyanmarCabo VerdeCambodiaCameroonCanadaCaribbeanCentral AmericaChileChinaColombiaCongoCosta RicaCroatiaCubaCzechoslovakiaDenmarkDominicaDominican RepublicEastern AfricaEastern AsiaEastern EuropeEcuadorEgyptEl SalvadorEnglandEritreaEthiopiaEuropeFijiFranceGermanyGhanaGreeceGrenadaGuatemalaGuyanaHaitiHondurasHong KongHungaryIndiaIndonesiaIranIraqIrelandIsraelItalyJamaicaJapanJordanKazakhstanKenyaKoreaKuwaitLaosLatin AmericaLatviaLebanonLiberiaLithuaniaMalaysiaMexicoMicronesiaMiddle AfricaMoldovaMoroccoNepalNetherlandsNicaraguaNigeriaNorth AmericaNorth MacedoniaNorthern AfricaNorthern EuropeNorwayOceaniaPakistanPanamaPeruPhilippinesPolandPortugalRomaniaRussiaSaudi ArabiaScotlandSenegalSerbiaSierra LeoneSingaporeSomaliaSouth AfricaSouth AmericaSouth Central AsiaSouth Eastern AsiaSouthern EuropeSpainSri LankaSt. Vincent and the GrenadinesSudanSwedenSwitzerlandSyriaTaiwanThailandTrinidad and TobagoTurkeyUgandaUkraineUruguayUzbekistanVenezuelaVietnamWest IndiesWestern AfricaWestern AsiaWestern EuropeYemenZaireZimbabweAzores
Tsimshian
Race
Ancestry
AfghanAfricanAlaska NativeAlaskan AthabascanAlbanianAleutAlsatianAmericanApacheArabArapahoArgentineanArmenianAssyrian/Chaldean/SyriacAustralianAustrianBahamianBangladeshiBarbadianBasqueBelgianBelizeanBermudanBhutaneseBlackfeetBolivianBrazilianBritishBritish West IndianBulgarianBurmeseCajunCambodianCanadianCape VerdeanCarpatho RusynCelticCentral AmericanCentral American IndianCherokeeCheyenneChickasawChileanChineseChippewaChoctawColombianColvilleComancheCosta RicanCreeCreekCroatianCrowCubanCypriotCzechCzechoslovakianDanishDelawareDominicanDutchDutch West IndianEastern EuropeanEcuadorianEgyptianEnglishEstonianEthiopianEuropeanFijianFilipinoFinnishFrenchFrench American IndianFrench CanadianGermanGerman RussianGhanaianGreekGuamanian/ChamorroGuatemalanGuyaneseHaitianHmongHonduranHopiHoumaHungarianIcelanderIndian (Asian)IndonesianInupiatIranianIraqiIrishIroquoisIsraeliItalianJamaicanJapaneseJordanianKenyanKiowaKoreanLaotianLatvianLebaneseLiberianLithuanianLumbeeLuxembourgerMacedonianMalaysianMalteseMarshalleseMenomineeMexicanMexican American IndianMongolianMoroccanNative HawaiianNavajoNepaleseNew ZealanderNicaraguanNigerianNorthern EuropeanNorwegianOkinawanOsageOttawaPaiutePakistaniPalestinianPanamanianParaguayanPennsylvania GermanPeruvianPimaPolishPortuguesePotawatomiPuebloPuerto RicanPuget Sound SalishRomanianRussianSalvadoranSamoanScandinavianScotch-IrishScottishSeminoleSenegaleseSerbianShoshoneSierra LeoneanSiouxSlavicSlovakSloveneSomaliSouth AfricanSouth AmericanSouth American IndianSoviet UnionSpaniardSpanishSpanish AmericanSpanish American IndianSri LankanSubsaharan AfricanSudaneseSwedishSwissSyrianTaiwaneseThaiTlingit-HaidaTohono O'OdhamTonganTrinidadian and TobagonianTsimshianTurkishU.S. Virgin IslanderUgandanUkrainianUruguayanUteVenezuelanVietnameseWelshWest IndianYakamaYaquiYugoslavianYumanYup'ikZimbabwean
Immigration
NonimmigrantsImmigrantsAfghanistanAfricaAlbaniaArgentinaArmeniaAsiaAustraliaAustriaBahamasBangladeshBarbadosBelarusBelgiumBelizeBoliviaBosnia and HerzegovinaBrazilBulgariaBurma/MyanmarCabo VerdeCambodiaCameroonCanadaCaribbeanCentral AmericaChileChinaColombiaCongoCosta RicaCroatiaCubaCzechoslovakiaDenmarkDominicaDominican RepublicEastern AfricaEastern AsiaEastern EuropeEcuadorEgyptEl SalvadorEnglandEritreaEthiopiaEuropeFijiFranceGermanyGhanaGreeceGrenadaGuatemalaGuyanaHaitiHondurasHong KongHungaryIndiaIndonesiaIranIraqIrelandIsraelItalyJamaicaJapanJordanKazakhstanKenyaKoreaKuwaitLaosLatin AmericaLatviaLebanonLiberiaMalaysiaMexicoMicronesiaMiddle AfricaMoldovaMoroccoNepalNetherlandsNicaraguaNigeriaNorth AmericaNorth MacedoniaNorthern AfricaNorthern EuropeNorwayOceaniaPakistanPanamaPeruPhilippinesPolandPortugalRomaniaRussiaSaudi ArabiaScotlandSenegalSerbiaSierra LeoneSingaporeSomaliaSouth AfricaSouth AmericaSouth Central AsiaSouth Eastern AsiaSouthern EuropeSpainSri LankaSt. Vincent and the GrenadinesSudanSwedenSwitzerlandSyriaTaiwanThailandTrinidad and TobagoTurkeyUgandaUkraineUruguayUzbekistanVenezuelaVietnamWest IndiesWestern AfricaWestern AsiaWestern EuropeYemenZaireZimbabweAzores
Receiving Food Stamps
Income
Poverty
Unemployment
Labor Participation
Family Structure
Vehicle Availability
Education Level
Disability

Receiving Food Stamps Comparison

Immigrants from Lithuania

Tsimshian

Exceptional
Tragic
9.2%
RECEIVING FOOD STAMPS
99.8/ 100
METRIC RATING
29th/ 347
METRIC RANK
15.7%
RECEIVING FOOD STAMPS
0.0/ 100
METRIC RATING
296th/ 347
METRIC RANK

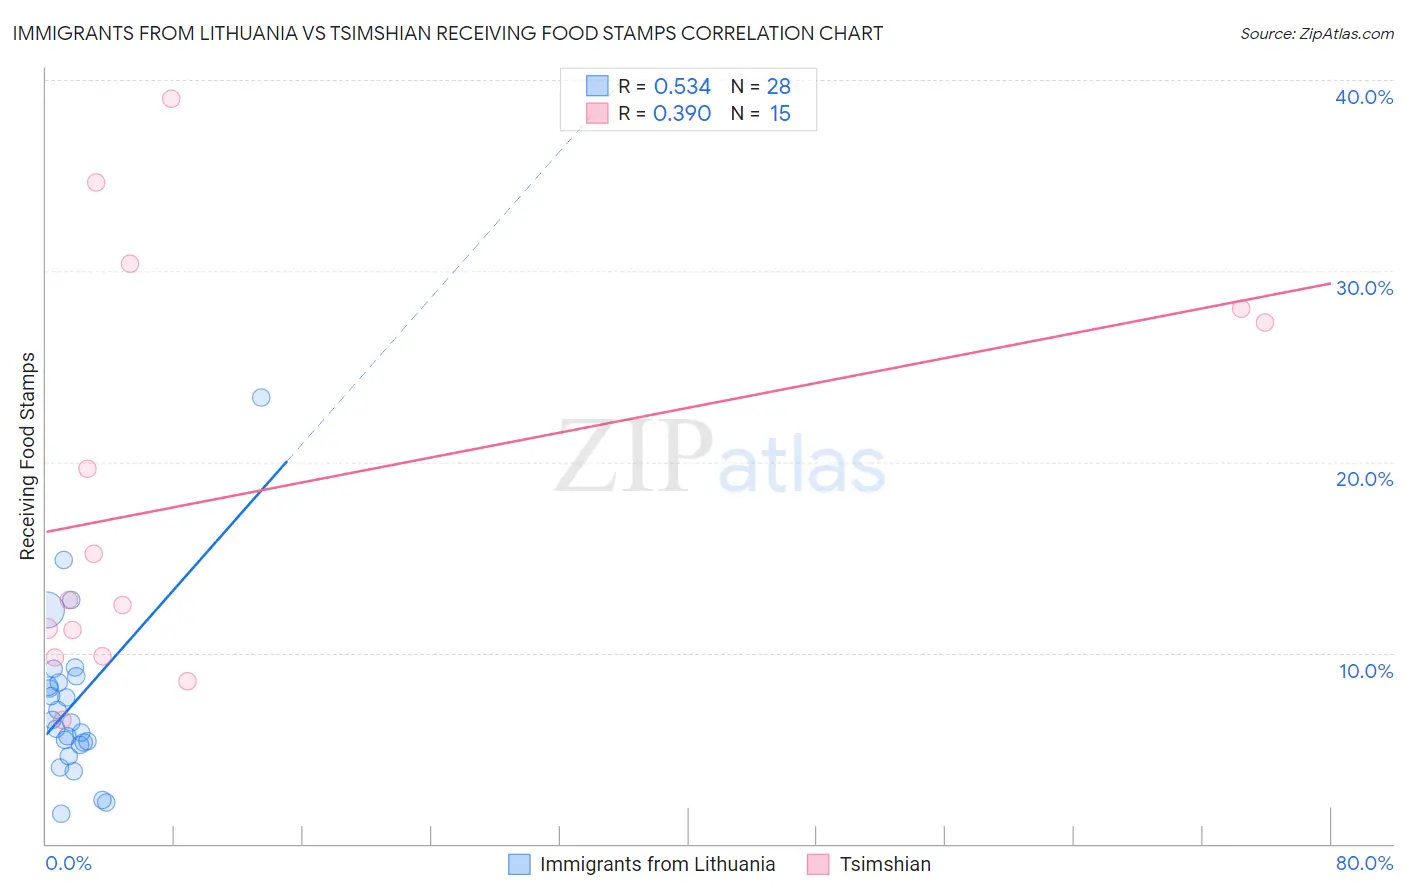
Immigrants from Lithuania vs Tsimshian Receiving Food Stamps Correlation Chart

The statistical analysis conducted on geographies consisting of 117,609,856 people shows a substantial positive correlation between the proportion of Immigrants from Lithuania and percentage of population receiving government assistance and/or food stamps in the United States with a correlation coefficient (R) of 0.534 and weighted average of 9.2%. Similarly, the statistical analysis conducted on geographies consisting of 15,626,544 people shows a mild positive correlation between the proportion of Tsimshian and percentage of population receiving government assistance and/or food stamps in the United States with a correlation coefficient (R) of 0.390 and weighted average of 15.7%, a difference of 70.2%.
Immigrants from Lithuania vs Tsimshian Receiving Food Stamps

Receiving Food Stamps Correlation Summary

MeasurementImmigrants from LithuaniaTsimshian
Minimum1.6%6.5%
Maximum23.4%39.0%
Range21.8%32.5%
Mean7.4%18.4%
Median6.4%12.8%
Interquartile 25% (IQ1)5.2%9.8%
Interquartile 75% (IQ3)8.6%28.0%
Interquartile Range (IQR)3.4%18.2%
Standard Deviation (Sample)4.4%10.6%
Standard Deviation (Population)4.3%10.2%

Similar Demographics by Receiving Food Stamps

Demographics Similar to Immigrants from Lithuania by Receiving Food Stamps

In terms of receiving food stamps, the demographic groups most similar to Immigrants from Lithuania are Czech (9.2%, a difference of 0.27%), Bhutanese (9.2%, a difference of 0.28%), Immigrants from Sweden (9.3%, a difference of 0.37%), Swedish (9.2%, a difference of 0.52%), and Immigrants from Ireland (9.2%, a difference of 0.72%).
DemographicsRating | RankReceiving Food Stamps
Immigrants | Australia
99.8
/100
|
#22
Exceptional
9.2%
Eastern Europeans
99.8
/100
|
#23
Exceptional
9.2%
Immigrants | Northern Europe
99.8
/100
|
#24
Exceptional
9.2%
Immigrants | Ireland
99.8
/100
|
#25
Exceptional
9.2%
Swedes
99.8
/100
|
#26
Exceptional
9.2%
Bhutanese
99.8
/100
|
#27
Exceptional
9.2%
Czechs
99.8
/100
|
#28
Exceptional
9.2%
Immigrants | Lithuania
99.8
/100
|
#29
Exceptional
9.2%
Immigrants | Sweden
99.7
/100
|
#30
Exceptional
9.3%
Immigrants | Eastern Asia
99.7
/100
|
#31
Exceptional
9.3%
Bolivians
99.7
/100
|
#32
Exceptional
9.3%
Zimbabweans
99.6
/100
|
#33
Exceptional
9.5%
Turks
99.6
/100
|
#34
Exceptional
9.5%
Immigrants | Austria
99.6
/100
|
#35
Exceptional
9.5%
Estonians
99.6
/100
|
#36
Exceptional
9.5%

Demographics Similar to Tsimshian by Receiving Food Stamps

In terms of receiving food stamps, the demographic groups most similar to Tsimshian are Immigrants from Honduras (15.7%, a difference of 0.010%), Immigrants from Bahamas (15.8%, a difference of 0.16%), Immigrants from Latin America (15.7%, a difference of 0.33%), Immigrants from Trinidad and Tobago (15.8%, a difference of 0.41%), and Vietnamese (15.7%, a difference of 0.44%).
DemographicsRating | RankReceiving Food Stamps
Immigrants | Senegal
0.0
/100
|
#289
Tragic
15.3%
Senegalese
0.0
/100
|
#290
Tragic
15.4%
Hondurans
0.0
/100
|
#291
Tragic
15.5%
Alaska Natives
0.0
/100
|
#292
Tragic
15.6%
Vietnamese
0.0
/100
|
#293
Tragic
15.7%
Immigrants | Latin America
0.0
/100
|
#294
Tragic
15.7%
Immigrants | Honduras
0.0
/100
|
#295
Tragic
15.7%
Tsimshian
0.0
/100
|
#296
Tragic
15.7%
Immigrants | Bahamas
0.0
/100
|
#297
Tragic
15.8%
Immigrants | Trinidad and Tobago
0.0
/100
|
#298
Tragic
15.8%
Hispanics or Latinos
0.0
/100
|
#299
Tragic
15.8%
Immigrants | Bangladesh
0.0
/100
|
#300
Tragic
15.9%
Trinidadians and Tobagonians
0.0
/100
|
#301
Tragic
16.0%
Immigrants | West Indies
0.0
/100
|
#302
Tragic
16.1%
Nicaraguans
0.0
/100
|
#303
Tragic
16.1%