Immigrants from Kazakhstan vs Immigrants from Yemen Single Father Poverty

COMPARE

Immigrants from Kazakhstan
Race
Ancestry
AfghanAfricanAlaska NativeAlaskan AthabascanAlbanianAleutAlsatianAmericanApacheArabArapahoArgentineanArmenianAssyrian/Chaldean/SyriacAustralianAustrianBahamianBangladeshiBarbadianBasqueBelgianBelizeanBermudanBhutaneseBlackfeetBolivianBrazilianBritishBritish West IndianBulgarianBurmeseCajunCambodianCanadianCape VerdeanCarpatho RusynCelticCentral AmericanCentral American IndianCherokeeCheyenneChickasawChileanChineseChippewaChoctawColombianColvilleComancheCosta RicanCreeCreekCroatianCrowCubanCypriotCzechCzechoslovakianDanishDelawareDominicanDutchDutch West IndianEastern EuropeanEcuadorianEgyptianEnglishEstonianEthiopianEuropeanFijianFilipinoFinnishFrenchFrench American IndianFrench CanadianGermanGerman RussianGhanaianGreekGuamanian/ChamorroGuatemalanGuyaneseHaitianHmongHonduranHopiHoumaHungarianIcelanderIndian (Asian)IndonesianInupiatIranianIraqiIrishIroquoisIsraeliItalianJamaicanJapaneseJordanianKenyanKiowaKoreanLaotianLatvianLebaneseLiberianLithuanianLumbeeLuxembourgerMacedonianMalaysianMalteseMarshalleseMenomineeMexicanMexican American IndianMongolianMoroccanNative HawaiianNavajoNepaleseNew ZealanderNicaraguanNigerianNorthern EuropeanNorwegianOkinawanOsageOttawaPaiutePakistaniPalestinianPanamanianParaguayanPennsylvania GermanPeruvianPimaPolishPortuguesePotawatomiPuebloPuerto RicanPuget Sound SalishRomanianRussianSalvadoranSamoanScandinavianScotch-IrishScottishSeminoleSenegaleseSerbianShoshoneSierra LeoneanSiouxSlavicSlovakSloveneSomaliSouth AfricanSouth AmericanSouth American IndianSoviet UnionSpaniardSpanishSpanish AmericanSpanish American IndianSri LankanSubsaharan AfricanSudaneseSwedishSwissSyrianTaiwaneseThaiTlingit-HaidaTohono O'OdhamTonganTrinidadian and TobagonianTsimshianTurkishU.S. Virgin IslanderUgandanUkrainianUruguayanUteVenezuelanVietnameseWelshWest IndianYakamaYaquiYugoslavianYumanYup'ikZimbabwean
Immigration
NonimmigrantsImmigrantsAfghanistanAfricaAlbaniaArgentinaArmeniaAsiaAustraliaAustriaBahamasBangladeshBarbadosBelarusBelgiumBelizeBoliviaBosnia and HerzegovinaBrazilBulgariaBurma/MyanmarCabo VerdeCambodiaCameroonCanadaCaribbeanCentral AmericaChileChinaColombiaCongoCosta RicaCroatiaCubaCzechoslovakiaDenmarkDominicaDominican RepublicEastern AfricaEastern AsiaEastern EuropeEcuadorEgyptEl SalvadorEnglandEritreaEthiopiaEuropeFijiFranceGermanyGhanaGreeceGrenadaGuatemalaGuyanaHaitiHondurasHong KongHungaryIndiaIndonesiaIranIraqIrelandIsraelItalyJamaicaJapanJordanKazakhstanKenyaKoreaKuwaitLaosLatin AmericaLatviaLebanonLiberiaLithuaniaMalaysiaMexicoMicronesiaMiddle AfricaMoldovaMoroccoNepalNetherlandsNicaraguaNigeriaNorth AmericaNorth MacedoniaNorthern AfricaNorthern EuropeNorwayOceaniaPakistanPanamaPeruPhilippinesPolandPortugalRomaniaRussiaSaudi ArabiaScotlandSenegalSerbiaSierra LeoneSingaporeSomaliaSouth AfricaSouth AmericaSouth Central AsiaSouth Eastern AsiaSouthern EuropeSpainSri LankaSt. Vincent and the GrenadinesSudanSwedenSwitzerlandSyriaTaiwanThailandTrinidad and TobagoTurkeyUgandaUkraineUruguayUzbekistanVenezuelaVietnamWest IndiesWestern AfricaWestern AsiaWestern EuropeZaireZimbabweAzores
Immigrants from Yemen
Race
Ancestry
AfghanAfricanAlaska NativeAlaskan AthabascanAlbanianAleutAlsatianAmericanApacheArabArapahoArgentineanArmenianAssyrian/Chaldean/SyriacAustralianAustrianBahamianBangladeshiBarbadianBasqueBelgianBelizeanBermudanBhutaneseBlackfeetBolivianBrazilianBritishBritish West IndianBulgarianBurmeseCajunCambodianCanadianCape VerdeanCarpatho RusynCelticCentral AmericanCentral American IndianCherokeeCheyenneChickasawChileanChineseChippewaChoctawColombianColvilleComancheCosta RicanCreeCreekCroatianCrowCubanCypriotCzechCzechoslovakianDanishDelawareDominicanDutchDutch West IndianEastern EuropeanEcuadorianEgyptianEnglishEstonianEthiopianEuropeanFijianFilipinoFinnishFrenchFrench American IndianFrench CanadianGermanGerman RussianGhanaianGreekGuamanian/ChamorroGuatemalanGuyaneseHaitianHmongHonduranHopiHoumaHungarianIcelanderIndian (Asian)IndonesianInupiatIranianIraqiIrishIroquoisIsraeliItalianJamaicanJapaneseJordanianKenyanKiowaKoreanLaotianLatvianLebaneseLiberianLithuanianLumbeeLuxembourgerMacedonianMalaysianMalteseMarshalleseMenomineeMexicanMexican American IndianMongolianMoroccanNative HawaiianNavajoNepaleseNew ZealanderNicaraguanNigerianNorthern EuropeanNorwegianOkinawanOsageOttawaPaiutePakistaniPalestinianPanamanianParaguayanPennsylvania GermanPeruvianPimaPolishPortuguesePotawatomiPuebloPuerto RicanPuget Sound SalishRomanianRussianSalvadoranSamoanScandinavianScotch-IrishScottishSeminoleSenegaleseSerbianShoshoneSierra LeoneanSiouxSlavicSlovakSloveneSomaliSouth AfricanSouth AmericanSouth American IndianSoviet UnionSpaniardSpanishSpanish AmericanSpanish American IndianSri LankanSubsaharan AfricanSudaneseSwedishSwissSyrianTaiwaneseThaiTlingit-HaidaTohono O'OdhamTonganTrinidadian and TobagonianTsimshianTurkishU.S. Virgin IslanderUgandanUkrainianUruguayanUteVenezuelanVietnameseWelshWest IndianYakamaYaquiYugoslavianYumanYup'ikZimbabwean
Immigration
NonimmigrantsImmigrantsAfghanistanAfricaAlbaniaArgentinaArmeniaAsiaAustraliaAustriaBahamasBangladeshBarbadosBelarusBelgiumBelizeBoliviaBosnia and HerzegovinaBrazilBulgariaBurma/MyanmarCabo VerdeCambodiaCameroonCanadaCaribbeanCentral AmericaChileChinaColombiaCongoCosta RicaCroatiaCubaCzechoslovakiaDenmarkDominicaDominican RepublicEastern AfricaEastern AsiaEastern EuropeEcuadorEgyptEl SalvadorEnglandEritreaEthiopiaEuropeFijiFranceGermanyGhanaGreeceGrenadaGuatemalaGuyanaHaitiHondurasHong KongHungaryIndiaIndonesiaIranIraqIrelandIsraelItalyJamaicaJapanJordanKenyaKoreaKuwaitLaosLatin AmericaLatviaLebanonLiberiaLithuaniaMalaysiaMexicoMicronesiaMiddle AfricaMoldovaMoroccoNepalNetherlandsNicaraguaNigeriaNorth AmericaNorth MacedoniaNorthern AfricaNorthern EuropeNorwayOceaniaPakistanPanamaPeruPhilippinesPolandPortugalRomaniaRussiaSaudi ArabiaScotlandSenegalSerbiaSierra LeoneSingaporeSomaliaSouth AfricaSouth AmericaSouth Central AsiaSouth Eastern AsiaSouthern EuropeSpainSri LankaSt. Vincent and the GrenadinesSudanSwedenSwitzerlandSyriaTaiwanThailandTrinidad and TobagoTurkeyUgandaUkraineUruguayUzbekistanVenezuelaVietnamWest IndiesWestern AfricaWestern AsiaWestern EuropeYemenZaireZimbabweAzores
Single Father Poverty
Income
Poverty
Unemployment
Labor Participation
Family Structure
Vehicle Availability
Education Level
Disability

Single Father Poverty Comparison

Immigrants from Kazakhstan

Immigrants from Yemen

Exceptional
Tragic
15.6%
SINGLE FATHER POVERTY
98.2/ 100
METRIC RATING
95th/ 347
METRIC RANK
20.6%
SINGLE FATHER POVERTY
0.0/ 100
METRIC RATING
326th/ 347
METRIC RANK

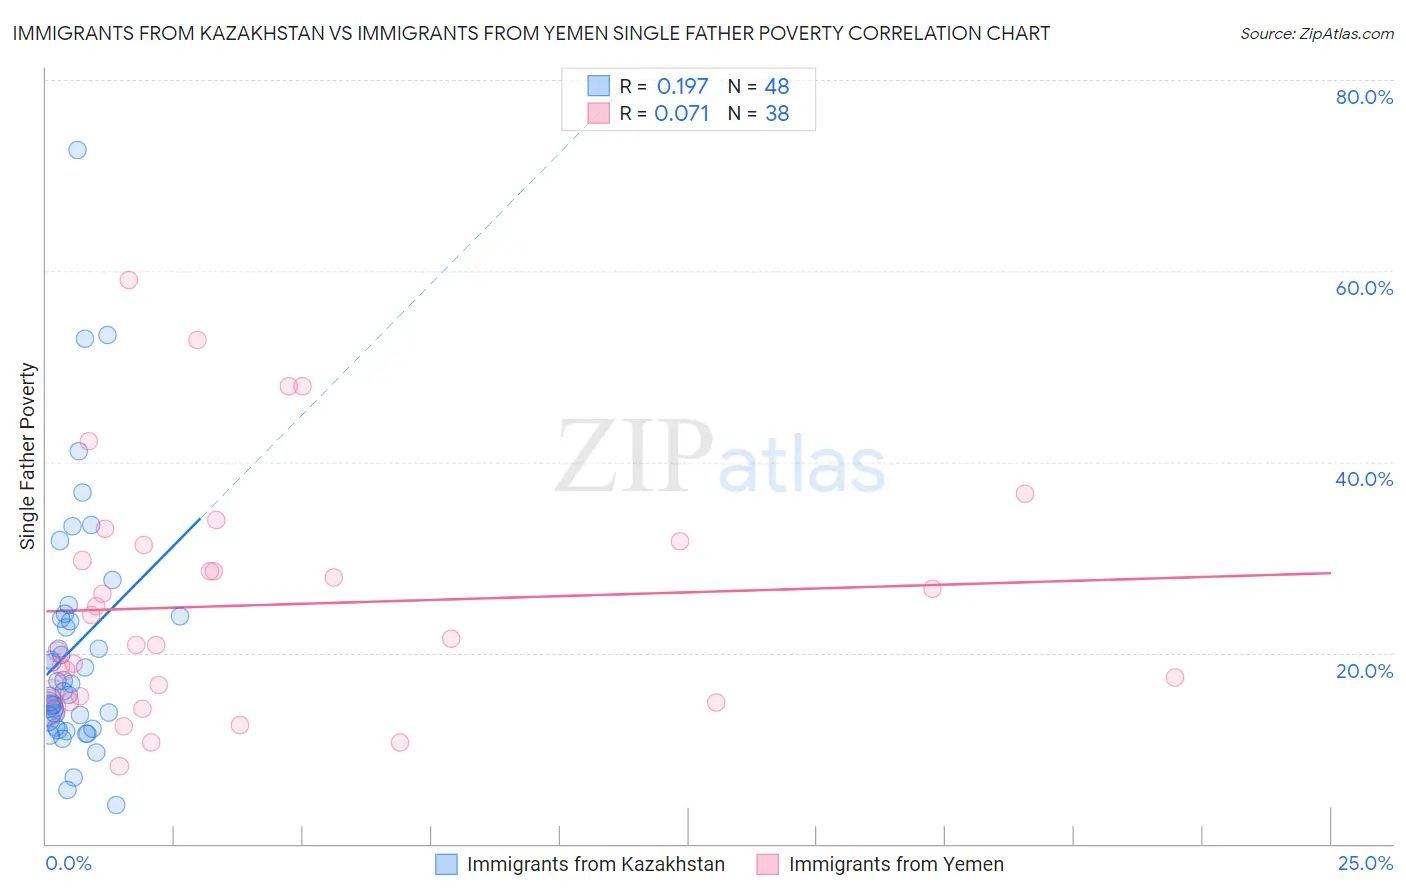
Immigrants from Kazakhstan vs Immigrants from Yemen Single Father Poverty Correlation Chart

The statistical analysis conducted on geographies consisting of 108,344,450 people shows a poor positive correlation between the proportion of Immigrants from Kazakhstan and poverty level among single fathers in the United States with a correlation coefficient (R) of 0.197 and weighted average of 15.6%. Similarly, the statistical analysis conducted on geographies consisting of 76,647,654 people shows a slight positive correlation between the proportion of Immigrants from Yemen and poverty level among single fathers in the United States with a correlation coefficient (R) of 0.071 and weighted average of 20.6%, a difference of 32.1%.
Immigrants from Kazakhstan vs Immigrants from Yemen Single Father Poverty

Single Father Poverty Correlation Summary

MeasurementImmigrants from KazakhstanImmigrants from Yemen
Minimum4.0%8.1%
Maximum72.7%59.1%
Range68.7%51.0%
Mean20.5%25.0%
Median16.4%21.1%
Interquartile 25% (IQ1)12.7%15.5%
Interquartile 75% (IQ3)23.7%31.3%
Interquartile Range (IQR)11.0%15.9%
Standard Deviation (Sample)13.1%12.4%
Standard Deviation (Population)12.9%12.2%

Similar Demographics by Single Father Poverty

Demographics Similar to Immigrants from Kazakhstan by Single Father Poverty

In terms of single father poverty, the demographic groups most similar to Immigrants from Kazakhstan are Immigrants from Belgium (15.6%, a difference of 0.010%), Yaqui (15.6%, a difference of 0.020%), Zimbabwean (15.6%, a difference of 0.030%), Immigrants from Uruguay (15.6%, a difference of 0.050%), and Basque (15.5%, a difference of 0.19%).
DemographicsRating | RankSingle Father Poverty
Burmese
99.0
/100
|
#88
Exceptional
15.5%
Immigrants | Korea
99.0
/100
|
#89
Exceptional
15.5%
Mexican American Indians
98.7
/100
|
#90
Exceptional
15.5%
Immigrants | Romania
98.6
/100
|
#91
Exceptional
15.5%
Immigrants | Serbia
98.5
/100
|
#92
Exceptional
15.5%
Basques
98.4
/100
|
#93
Exceptional
15.5%
Immigrants | Uruguay
98.2
/100
|
#94
Exceptional
15.6%
Immigrants | Kazakhstan
98.2
/100
|
#95
Exceptional
15.6%
Immigrants | Belgium
98.1
/100
|
#96
Exceptional
15.6%
Yaqui
98.1
/100
|
#97
Exceptional
15.6%
Zimbabweans
98.1
/100
|
#98
Exceptional
15.6%
Immigrants | Middle Africa
97.4
/100
|
#99
Exceptional
15.6%
Immigrants | Chile
96.9
/100
|
#100
Exceptional
15.7%
Fijians
96.8
/100
|
#101
Exceptional
15.7%
Chileans
96.4
/100
|
#102
Exceptional
15.7%

Demographics Similar to Immigrants from Yemen by Single Father Poverty

In terms of single father poverty, the demographic groups most similar to Immigrants from Yemen are Choctaw (20.7%, a difference of 0.69%), Black/African American (20.4%, a difference of 1.0%), American (20.1%, a difference of 2.6%), Pueblo (21.1%, a difference of 2.6%), and Pennsylvania German (20.0%, a difference of 2.8%).
DemographicsRating | RankSingle Father Poverty
Slovaks
0.0
/100
|
#319
Tragic
19.3%
Inupiat
0.0
/100
|
#320
Tragic
19.5%
Cherokee
0.0
/100
|
#321
Tragic
19.6%
Creek
0.0
/100
|
#322
Tragic
19.8%
Pennsylvania Germans
0.0
/100
|
#323
Tragic
20.0%
Americans
0.0
/100
|
#324
Tragic
20.1%
Blacks/African Americans
0.0
/100
|
#325
Tragic
20.4%
Immigrants | Yemen
0.0
/100
|
#326
Tragic
20.6%
Choctaw
0.0
/100
|
#327
Tragic
20.7%
Pueblo
0.0
/100
|
#328
Tragic
21.1%
Colville
0.0
/100
|
#329
Tragic
21.4%
Paiute
0.0
/100
|
#330
Tragic
21.6%
Central American Indians
0.0
/100
|
#331
Tragic
21.7%
Tohono O'odham
0.0
/100
|
#332
Tragic
22.0%
Natives/Alaskans
0.0
/100
|
#333
Tragic
22.4%