Immigrants from Kazakhstan vs Immigrants from Yemen 5th Grade
COMPARE
Immigrants from Kazakhstan
Immigrants from Yemen
5th Grade
5th Grade Comparison
Immigrants from Kazakhstan
Immigrants from Yemen
97.3%
5TH GRADE
50.0/ 100
METRIC RATING
174th/ 347
METRIC RANK
94.9%
5TH GRADE
0.0/ 100
METRIC RATING
339th/ 347
METRIC RANK
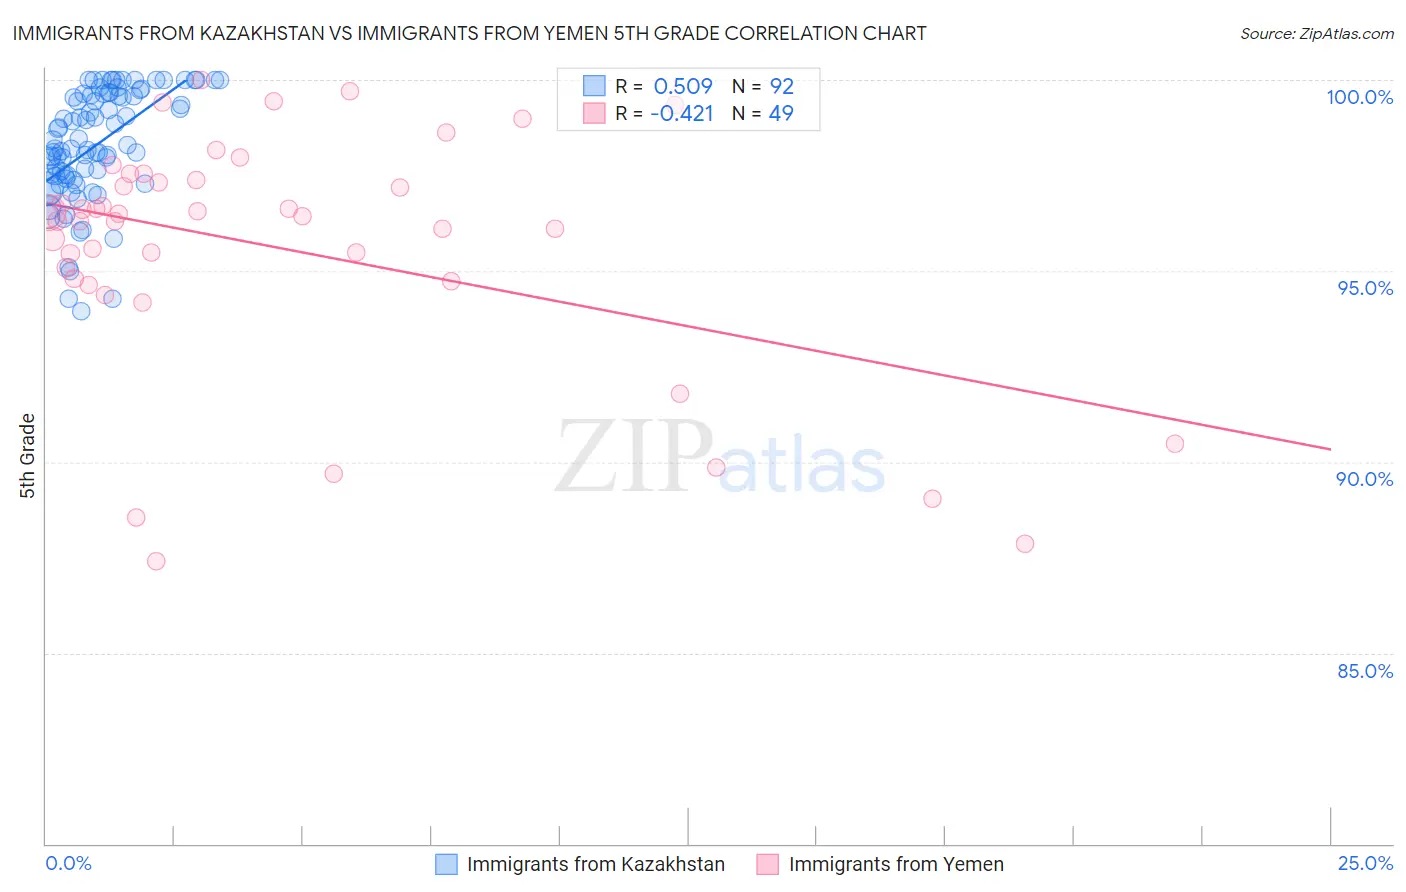
Immigrants from Kazakhstan vs Immigrants from Yemen 5th Grade Correlation Chart
The statistical analysis conducted on geographies consisting of 124,430,097 people shows a substantial positive correlation between the proportion of Immigrants from Kazakhstan and percentage of population with at least 5th grade education in the United States with a correlation coefficient (R) of 0.509 and weighted average of 97.3%. Similarly, the statistical analysis conducted on geographies consisting of 82,429,885 people shows a moderate negative correlation between the proportion of Immigrants from Yemen and percentage of population with at least 5th grade education in the United States with a correlation coefficient (R) of -0.421 and weighted average of 94.9%, a difference of 2.6%.
5th Grade Correlation Summary
| Measurement | Immigrants from Kazakhstan | Immigrants from Yemen |
| Minimum | 93.9% | 87.4% |
| Maximum | 100.0% | 100.0% |
| Range | 6.1% | 12.6% |
| Mean | 98.3% | 95.6% |
| Median | 98.3% | 96.4% |
| Interquartile 25% (IQ1) | 97.5% | 94.8% |
| Interquartile 75% (IQ3) | 99.6% | 97.5% |
| Interquartile Range (IQR) | 2.2% | 2.7% |
| Standard Deviation (Sample) | 1.5% | 3.2% |
| Standard Deviation (Population) | 1.5% | 3.1% |
Similar Demographics by 5th Grade
Demographics Similar to Immigrants from Kazakhstan by 5th Grade
In terms of 5th grade, the demographic groups most similar to Immigrants from Kazakhstan are Arab (97.3%, a difference of 0.010%), Egyptian (97.3%, a difference of 0.010%), Immigrants from Micronesia (97.3%, a difference of 0.010%), Immigrants from Taiwan (97.3%, a difference of 0.010%), and Immigrants from Spain (97.3%, a difference of 0.010%).
| Demographics | Rating | Rank | 5th Grade |
| Immigrants | Belarus | 54.6 /100 | #167 | Average 97.3% |
| Chileans | 54.5 /100 | #168 | Average 97.3% |
| Immigrants | Korea | 54.1 /100 | #169 | Average 97.3% |
| Venezuelans | 54.0 /100 | #170 | Average 97.3% |
| Immigrants | Sri Lanka | 53.8 /100 | #171 | Average 97.3% |
| Arabs | 53.4 /100 | #172 | Average 97.3% |
| Egyptians | 52.4 /100 | #173 | Average 97.3% |
| Immigrants | Kazakhstan | 50.0 /100 | #174 | Average 97.3% |
| Immigrants | Micronesia | 48.8 /100 | #175 | Average 97.3% |
| Immigrants | Taiwan | 48.4 /100 | #176 | Average 97.3% |
| Immigrants | Spain | 47.0 /100 | #177 | Average 97.3% |
| Comanche | 42.1 /100 | #178 | Average 97.3% |
| Immigrants | Kenya | 40.3 /100 | #179 | Average 97.3% |
| Pakistanis | 40.2 /100 | #180 | Average 97.3% |
| Argentineans | 39.5 /100 | #181 | Fair 97.3% |
Demographics Similar to Immigrants from Yemen by 5th Grade
In terms of 5th grade, the demographic groups most similar to Immigrants from Yemen are Guatemalan (94.8%, a difference of 0.030%), Immigrants from Cabo Verde (94.9%, a difference of 0.050%), Yakama (94.8%, a difference of 0.10%), Central American (95.1%, a difference of 0.21%), and Immigrants from Central America (94.7%, a difference of 0.21%).
| Demographics | Rating | Rank | 5th Grade |
| Immigrants | Dominican Republic | 0.0 /100 | #332 | Tragic 95.3% |
| Immigrants | Latin America | 0.0 /100 | #333 | Tragic 95.3% |
| Nepalese | 0.0 /100 | #334 | Tragic 95.2% |
| Mexicans | 0.0 /100 | #335 | Tragic 95.2% |
| Immigrants | Azores | 0.0 /100 | #336 | Tragic 95.1% |
| Central Americans | 0.0 /100 | #337 | Tragic 95.1% |
| Immigrants | Cabo Verde | 0.0 /100 | #338 | Tragic 94.9% |
| Immigrants | Yemen | 0.0 /100 | #339 | Tragic 94.9% |
| Guatemalans | 0.0 /100 | #340 | Tragic 94.8% |
| Yakama | 0.0 /100 | #341 | Tragic 94.8% |
| Immigrants | Central America | 0.0 /100 | #342 | Tragic 94.7% |
| Salvadorans | 0.0 /100 | #343 | Tragic 94.6% |
| Immigrants | Mexico | 0.0 /100 | #344 | Tragic 94.6% |
| Immigrants | Guatemala | 0.0 /100 | #345 | Tragic 94.6% |
| Immigrants | El Salvador | 0.0 /100 | #346 | Tragic 94.3% |