Immigrants from Ghana vs Cuban Child Poverty Among Girls Under 16

COMPARE

Immigrants from Ghana
Race
Ancestry
AfghanAfricanAlaska NativeAlaskan AthabascanAlbanianAleutAlsatianAmericanApacheArabArapahoArgentineanArmenianAssyrian/Chaldean/SyriacAustralianAustrianBahamianBangladeshiBarbadianBasqueBelgianBelizeanBermudanBhutaneseBlackfeetBolivianBrazilianBritishBritish West IndianBulgarianBurmeseCajunCambodianCanadianCape VerdeanCarpatho RusynCelticCentral AmericanCentral American IndianCherokeeCheyenneChickasawChileanChineseChippewaChoctawColombianColvilleComancheCosta RicanCreeCreekCroatianCrowCypriotCzechCzechoslovakianDanishDelawareDominicanDutchDutch West IndianEastern EuropeanEcuadorianEgyptianEnglishEstonianEthiopianEuropeanFijianFilipinoFinnishFrenchFrench American IndianFrench CanadianGermanGerman RussianGhanaianGreekGuamanian/ChamorroGuatemalanGuyaneseHaitianHmongHonduranHopiHoumaHungarianIcelanderIndian (Asian)IndonesianInupiatIranianIraqiIrishIroquoisIsraeliItalianJamaicanJapaneseJordanianKenyanKiowaKoreanLaotianLatvianLebaneseLiberianLithuanianLumbeeLuxembourgerMacedonianMalaysianMalteseMarshalleseMenomineeMexicanMexican American IndianMongolianMoroccanNative HawaiianNavajoNepaleseNew ZealanderNicaraguanNigerianNorthern EuropeanNorwegianOkinawanOsageOttawaPaiutePakistaniPalestinianPanamanianParaguayanPennsylvania GermanPeruvianPimaPolishPortuguesePotawatomiPuebloPuerto RicanPuget Sound SalishRomanianRussianSalvadoranSamoanScandinavianScotch-IrishScottishSeminoleSenegaleseSerbianShoshoneSierra LeoneanSiouxSlavicSlovakSloveneSomaliSouth AfricanSouth AmericanSouth American IndianSoviet UnionSpaniardSpanishSpanish AmericanSpanish American IndianSri LankanSubsaharan AfricanSudaneseSwedishSwissSyrianTaiwaneseThaiTlingit-HaidaTohono O'OdhamTonganTrinidadian and TobagonianTsimshianTurkishU.S. Virgin IslanderUgandanUkrainianUruguayanUteVenezuelanVietnameseWelshWest IndianYakamaYaquiYugoslavianYumanYup'ikZimbabwean
Immigration
NonimmigrantsImmigrantsAfghanistanAfricaAlbaniaArgentinaArmeniaAsiaAustraliaAustriaBahamasBangladeshBarbadosBelarusBelgiumBelizeBoliviaBosnia and HerzegovinaBrazilBulgariaBurma/MyanmarCabo VerdeCambodiaCameroonCanadaCaribbeanCentral AmericaChileChinaColombiaCongoCosta RicaCroatiaCubaCzechoslovakiaDenmarkDominicaDominican RepublicEastern AfricaEastern AsiaEastern EuropeEcuadorEgyptEl SalvadorEnglandEritreaEthiopiaEuropeFijiFranceGermanyGhanaGreeceGrenadaGuatemalaGuyanaHaitiHondurasHong KongHungaryIndiaIndonesiaIranIraqIrelandIsraelItalyJamaicaJapanJordanKazakhstanKenyaKoreaKuwaitLaosLatin AmericaLatviaLebanonLiberiaLithuaniaMalaysiaMexicoMicronesiaMiddle AfricaMoldovaMoroccoNepalNetherlandsNicaraguaNigeriaNorth AmericaNorth MacedoniaNorthern AfricaNorthern EuropeNorwayOceaniaPakistanPanamaPeruPhilippinesPolandPortugalRomaniaRussiaSaudi ArabiaScotlandSenegalSerbiaSierra LeoneSingaporeSomaliaSouth AfricaSouth AmericaSouth Central AsiaSouth Eastern AsiaSouthern EuropeSpainSri LankaSt. Vincent and the GrenadinesSudanSwedenSwitzerlandSyriaTaiwanThailandTrinidad and TobagoTurkeyUgandaUkraineUruguayUzbekistanVenezuelaVietnamWest IndiesWestern AfricaWestern AsiaWestern EuropeYemenZaireZimbabweAzores
Cuban
Race
Ancestry
AfghanAfricanAlaska NativeAlaskan AthabascanAlbanianAleutAlsatianAmericanApacheArabArapahoArgentineanArmenianAssyrian/Chaldean/SyriacAustralianAustrianBahamianBangladeshiBarbadianBasqueBelgianBelizeanBermudanBhutaneseBlackfeetBolivianBrazilianBritishBritish West IndianBulgarianBurmeseCajunCambodianCanadianCape VerdeanCarpatho RusynCelticCentral AmericanCentral American IndianCherokeeCheyenneChickasawChileanChineseChippewaChoctawColombianColvilleComancheCosta RicanCreeCreekCroatianCrowCubanCypriotCzechCzechoslovakianDanishDelawareDominicanDutchDutch West IndianEastern EuropeanEcuadorianEgyptianEnglishEstonianEthiopianEuropeanFijianFilipinoFinnishFrenchFrench American IndianFrench CanadianGermanGerman RussianGhanaianGreekGuamanian/ChamorroGuatemalanGuyaneseHaitianHmongHonduranHopiHoumaHungarianIcelanderIndian (Asian)IndonesianInupiatIranianIraqiIrishIroquoisIsraeliItalianJamaicanJapaneseJordanianKenyanKiowaKoreanLaotianLatvianLebaneseLiberianLithuanianLumbeeLuxembourgerMacedonianMalaysianMalteseMarshalleseMenomineeMexicanMexican American IndianMongolianMoroccanNative HawaiianNavajoNepaleseNew ZealanderNicaraguanNigerianNorthern EuropeanNorwegianOkinawanOsageOttawaPaiutePakistaniPalestinianPanamanianParaguayanPennsylvania GermanPeruvianPimaPolishPortuguesePotawatomiPuebloPuerto RicanPuget Sound SalishRomanianRussianSalvadoranSamoanScandinavianScotch-IrishScottishSeminoleSenegaleseSerbianShoshoneSierra LeoneanSiouxSlavicSlovakSloveneSomaliSouth AfricanSouth AmericanSouth American IndianSoviet UnionSpaniardSpanishSpanish AmericanSpanish American IndianSri LankanSubsaharan AfricanSudaneseSwedishSwissSyrianTaiwaneseThaiTlingit-HaidaTohono O'OdhamTonganTrinidadian and TobagonianTsimshianTurkishU.S. Virgin IslanderUgandanUkrainianUruguayanUteVenezuelanVietnameseWelshWest IndianYakamaYaquiYugoslavianYumanYup'ikZimbabwean
Immigration
NonimmigrantsImmigrantsAfghanistanAfricaAlbaniaArgentinaArmeniaAsiaAustraliaAustriaBahamasBangladeshBarbadosBelarusBelgiumBelizeBoliviaBosnia and HerzegovinaBrazilBulgariaBurma/MyanmarCabo VerdeCambodiaCameroonCanadaCaribbeanCentral AmericaChileChinaColombiaCongoCosta RicaCroatiaCubaCzechoslovakiaDenmarkDominicaDominican RepublicEastern AfricaEastern AsiaEastern EuropeEcuadorEgyptEl SalvadorEnglandEritreaEthiopiaEuropeFijiFranceGermanyGreeceGrenadaGuatemalaGuyanaHaitiHondurasHong KongHungaryIndiaIndonesiaIranIraqIrelandIsraelItalyJamaicaJapanJordanKazakhstanKenyaKoreaKuwaitLaosLatin AmericaLatviaLebanonLiberiaLithuaniaMalaysiaMexicoMicronesiaMiddle AfricaMoldovaMoroccoNepalNetherlandsNicaraguaNigeriaNorth AmericaNorth MacedoniaNorthern AfricaNorthern EuropeNorwayOceaniaPakistanPanamaPeruPhilippinesPolandPortugalRomaniaRussiaSaudi ArabiaScotlandSenegalSerbiaSierra LeoneSingaporeSomaliaSouth AfricaSouth AmericaSouth Central AsiaSouth Eastern AsiaSouthern EuropeSpainSri LankaSt. Vincent and the GrenadinesSudanSwedenSwitzerlandSyriaTaiwanThailandTrinidad and TobagoTurkeyUgandaUkraineUruguayUzbekistanVenezuelaVietnamWest IndiesWestern AfricaWestern AsiaWestern EuropeYemenZaireZimbabweAzores
Child Poverty Among Girls Under 16
Income
Poverty
Unemployment
Labor Participation
Family Structure
Vehicle Availability
Education Level
Disability

Child Poverty Among Girls Under 16 Comparison

Immigrants from Ghana

Cubans

Tragic
Tragic
18.9%
CHILD POVERTY AMONG GIRLS UNDER 16
0.5/ 100
METRIC RATING
247th/ 347
METRIC RANK
18.0%
CHILD POVERTY AMONG GIRLS UNDER 16
4.1/ 100
METRIC RATING
220th/ 347
METRIC RANK

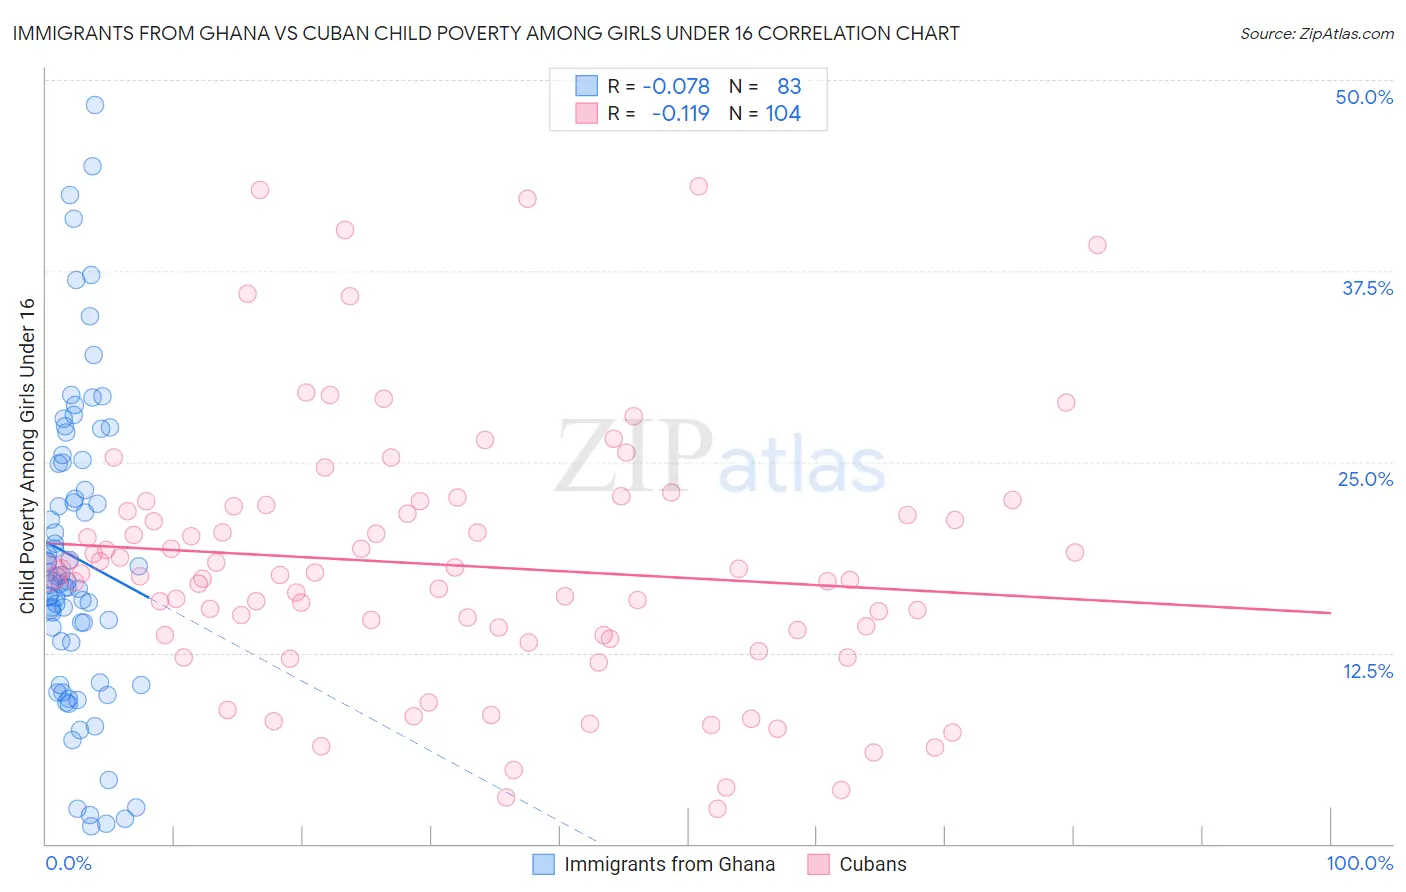
Immigrants from Ghana vs Cuban Child Poverty Among Girls Under 16 Correlation Chart

The statistical analysis conducted on geographies consisting of 198,244,595 people shows a slight negative correlation between the proportion of Immigrants from Ghana and poverty level among girls under the age of 16 in the United States with a correlation coefficient (R) of -0.078 and weighted average of 18.9%. Similarly, the statistical analysis conducted on geographies consisting of 440,192,797 people shows a poor negative correlation between the proportion of Cubans and poverty level among girls under the age of 16 in the United States with a correlation coefficient (R) of -0.119 and weighted average of 18.0%, a difference of 5.5%.
Immigrants from Ghana vs Cuban Child Poverty Among Girls Under 16

Child Poverty Among Girls Under 16 Correlation Summary

MeasurementImmigrants from GhanaCuban
Minimum1.1%2.3%
Maximum48.4%43.1%
Range47.2%40.8%
Mean18.7%18.2%
Median17.2%17.6%
Interquartile 25% (IQ1)13.2%13.7%
Interquartile 75% (IQ3)25.0%21.9%
Interquartile Range (IQR)11.8%8.3%
Standard Deviation (Sample)10.0%8.5%
Standard Deviation (Population)9.9%8.5%

Similar Demographics by Child Poverty Among Girls Under 16

Demographics Similar to Immigrants from Ghana by Child Poverty Among Girls Under 16

In terms of child poverty among girls under 16, the demographic groups most similar to Immigrants from Ghana are Immigrants from Laos (18.9%, a difference of 0.37%), Shoshone (18.9%, a difference of 0.39%), Ecuadorian (18.8%, a difference of 0.51%), Immigrants from Nicaragua (18.8%, a difference of 0.58%), and Immigrants from Cuba (18.8%, a difference of 0.80%).
DemographicsRating | RankChild Poverty Among Girls Under 16
Nigerians
0.9
/100
|
#240
Tragic
18.7%
Americans
0.8
/100
|
#241
Tragic
18.8%
Immigrants | Cuba
0.7
/100
|
#242
Tragic
18.8%
Immigrants | Nicaragua
0.7
/100
|
#243
Tragic
18.8%
Ecuadorians
0.7
/100
|
#244
Tragic
18.8%
Shoshone
0.6
/100
|
#245
Tragic
18.9%
Immigrants | Laos
0.6
/100
|
#246
Tragic
18.9%
Immigrants | Ghana
0.5
/100
|
#247
Tragic
18.9%
French American Indians
0.3
/100
|
#248
Tragic
19.2%
Potawatomi
0.3
/100
|
#249
Tragic
19.2%
Cape Verdeans
0.3
/100
|
#250
Tragic
19.2%
Immigrants | Trinidad and Tobago
0.3
/100
|
#251
Tragic
19.2%
Immigrants | Middle Africa
0.3
/100
|
#252
Tragic
19.2%
Immigrants | Guyana
0.3
/100
|
#253
Tragic
19.3%
Immigrants | Western Africa
0.3
/100
|
#254
Tragic
19.3%

Demographics Similar to Cubans by Child Poverty Among Girls Under 16

In terms of child poverty among girls under 16, the demographic groups most similar to Cubans are Immigrants from Panama (17.9%, a difference of 0.38%), Immigrants from Micronesia (18.0%, a difference of 0.43%), Alaska Native (17.8%, a difference of 0.62%), Japanese (17.8%, a difference of 0.72%), and Moroccan (17.8%, a difference of 0.80%).
DemographicsRating | RankChild Poverty Among Girls Under 16
Pennsylvania Germans
5.7
/100
|
#213
Tragic
17.8%
Malaysians
5.7
/100
|
#214
Tragic
17.8%
German Russians
5.7
/100
|
#215
Tragic
17.8%
Moroccans
5.5
/100
|
#216
Tragic
17.8%
Japanese
5.3
/100
|
#217
Tragic
17.8%
Alaska Natives
5.2
/100
|
#218
Tragic
17.8%
Immigrants | Panama
4.7
/100
|
#219
Tragic
17.9%
Cubans
4.1
/100
|
#220
Tragic
18.0%
Immigrants | Micronesia
3.5
/100
|
#221
Tragic
18.0%
Immigrants | Cambodia
2.9
/100
|
#222
Tragic
18.1%
Immigrants | Armenia
2.9
/100
|
#223
Tragic
18.1%
Bermudans
2.8
/100
|
#224
Tragic
18.1%
Immigrants | Africa
2.7
/100
|
#225
Tragic
18.2%
Nicaraguans
2.4
/100
|
#226
Tragic
18.2%
Immigrants | Nonimmigrants
2.0
/100
|
#227
Tragic
18.3%