Cajun vs Cuban Child Poverty Among Girls Under 16

COMPARE

Cajun
Race
Ancestry
AfghanAfricanAlaska NativeAlaskan AthabascanAlbanianAleutAlsatianAmericanApacheArabArapahoArgentineanArmenianAssyrian/Chaldean/SyriacAustralianAustrianBahamianBangladeshiBarbadianBasqueBelgianBelizeanBermudanBhutaneseBlackfeetBolivianBrazilianBritishBritish West IndianBulgarianBurmeseCajunCambodianCanadianCape VerdeanCarpatho RusynCelticCentral AmericanCentral American IndianCherokeeCheyenneChickasawChileanChineseChippewaChoctawColombianColvilleComancheCosta RicanCreeCreekCroatianCrowCypriotCzechCzechoslovakianDanishDelawareDominicanDutchDutch West IndianEastern EuropeanEcuadorianEgyptianEnglishEstonianEthiopianEuropeanFijianFilipinoFinnishFrenchFrench American IndianFrench CanadianGermanGerman RussianGhanaianGreekGuamanian/ChamorroGuatemalanGuyaneseHaitianHmongHonduranHopiHoumaHungarianIcelanderIndian (Asian)IndonesianInupiatIranianIraqiIrishIroquoisIsraeliItalianJamaicanJapaneseJordanianKenyanKiowaKoreanLaotianLatvianLebaneseLiberianLithuanianLumbeeLuxembourgerMacedonianMalaysianMalteseMarshalleseMenomineeMexicanMexican American IndianMongolianMoroccanNative HawaiianNavajoNepaleseNew ZealanderNicaraguanNigerianNorthern EuropeanNorwegianOkinawanOsageOttawaPaiutePakistaniPalestinianPanamanianParaguayanPennsylvania GermanPeruvianPimaPolishPortuguesePotawatomiPuebloPuerto RicanPuget Sound SalishRomanianRussianSalvadoranSamoanScandinavianScotch-IrishScottishSeminoleSenegaleseSerbianShoshoneSierra LeoneanSiouxSlavicSlovakSloveneSomaliSouth AfricanSouth AmericanSouth American IndianSoviet UnionSpaniardSpanishSpanish AmericanSpanish American IndianSri LankanSubsaharan AfricanSudaneseSwedishSwissSyrianTaiwaneseThaiTlingit-HaidaTohono O'OdhamTonganTrinidadian and TobagonianTsimshianTurkishU.S. Virgin IslanderUgandanUkrainianUruguayanUteVenezuelanVietnameseWelshWest IndianYakamaYaquiYugoslavianYumanYup'ikZimbabwean
Immigration
NonimmigrantsImmigrantsAfghanistanAfricaAlbaniaArgentinaArmeniaAsiaAustraliaAustriaBahamasBangladeshBarbadosBelarusBelgiumBelizeBoliviaBosnia and HerzegovinaBrazilBulgariaBurma/MyanmarCabo VerdeCambodiaCameroonCanadaCaribbeanCentral AmericaChileChinaColombiaCongoCosta RicaCroatiaCubaCzechoslovakiaDenmarkDominicaDominican RepublicEastern AfricaEastern AsiaEastern EuropeEcuadorEgyptEl SalvadorEnglandEritreaEthiopiaEuropeFijiFranceGermanyGhanaGreeceGrenadaGuatemalaGuyanaHaitiHondurasHong KongHungaryIndiaIndonesiaIranIraqIrelandIsraelItalyJamaicaJapanJordanKazakhstanKenyaKoreaKuwaitLaosLatin AmericaLatviaLebanonLiberiaLithuaniaMalaysiaMexicoMicronesiaMiddle AfricaMoldovaMoroccoNepalNetherlandsNicaraguaNigeriaNorth AmericaNorth MacedoniaNorthern AfricaNorthern EuropeNorwayOceaniaPakistanPanamaPeruPhilippinesPolandPortugalRomaniaRussiaSaudi ArabiaScotlandSenegalSerbiaSierra LeoneSingaporeSomaliaSouth AfricaSouth AmericaSouth Central AsiaSouth Eastern AsiaSouthern EuropeSpainSri LankaSt. Vincent and the GrenadinesSudanSwedenSwitzerlandSyriaTaiwanThailandTrinidad and TobagoTurkeyUgandaUkraineUruguayUzbekistanVenezuelaVietnamWest IndiesWestern AfricaWestern AsiaWestern EuropeYemenZaireZimbabweAzores
Cuban
Race
Ancestry
AfghanAfricanAlaska NativeAlaskan AthabascanAlbanianAleutAlsatianAmericanApacheArabArapahoArgentineanArmenianAssyrian/Chaldean/SyriacAustralianAustrianBahamianBangladeshiBarbadianBasqueBelgianBelizeanBermudanBhutaneseBlackfeetBolivianBrazilianBritishBritish West IndianBulgarianBurmeseCambodianCanadianCape VerdeanCarpatho RusynCelticCentral AmericanCentral American IndianCherokeeCheyenneChickasawChileanChineseChippewaChoctawColombianColvilleComancheCosta RicanCreeCreekCroatianCrowCubanCypriotCzechCzechoslovakianDanishDelawareDominicanDutchDutch West IndianEastern EuropeanEcuadorianEgyptianEnglishEstonianEthiopianEuropeanFijianFilipinoFinnishFrenchFrench American IndianFrench CanadianGermanGerman RussianGhanaianGreekGuamanian/ChamorroGuatemalanGuyaneseHaitianHmongHonduranHopiHoumaHungarianIcelanderIndian (Asian)IndonesianInupiatIranianIraqiIrishIroquoisIsraeliItalianJamaicanJapaneseJordanianKenyanKiowaKoreanLaotianLatvianLebaneseLiberianLithuanianLumbeeLuxembourgerMacedonianMalaysianMalteseMarshalleseMenomineeMexicanMexican American IndianMongolianMoroccanNative HawaiianNavajoNepaleseNew ZealanderNicaraguanNigerianNorthern EuropeanNorwegianOkinawanOsageOttawaPaiutePakistaniPalestinianPanamanianParaguayanPennsylvania GermanPeruvianPimaPolishPortuguesePotawatomiPuebloPuerto RicanPuget Sound SalishRomanianRussianSalvadoranSamoanScandinavianScotch-IrishScottishSeminoleSenegaleseSerbianShoshoneSierra LeoneanSiouxSlavicSlovakSloveneSomaliSouth AfricanSouth AmericanSouth American IndianSoviet UnionSpaniardSpanishSpanish AmericanSpanish American IndianSri LankanSubsaharan AfricanSudaneseSwedishSwissSyrianTaiwaneseThaiTlingit-HaidaTohono O'OdhamTonganTrinidadian and TobagonianTsimshianTurkishU.S. Virgin IslanderUgandanUkrainianUruguayanUteVenezuelanVietnameseWelshWest IndianYakamaYaquiYugoslavianYumanYup'ikZimbabwean
Immigration
NonimmigrantsImmigrantsAfghanistanAfricaAlbaniaArgentinaArmeniaAsiaAustraliaAustriaBahamasBangladeshBarbadosBelarusBelgiumBelizeBoliviaBosnia and HerzegovinaBrazilBulgariaBurma/MyanmarCabo VerdeCambodiaCameroonCanadaCaribbeanCentral AmericaChileChinaColombiaCongoCosta RicaCroatiaCubaCzechoslovakiaDenmarkDominicaDominican RepublicEastern AfricaEastern AsiaEastern EuropeEcuadorEgyptEl SalvadorEnglandEritreaEthiopiaEuropeFijiFranceGermanyGhanaGreeceGrenadaGuatemalaGuyanaHaitiHondurasHong KongHungaryIndiaIndonesiaIranIraqIrelandIsraelItalyJamaicaJapanJordanKazakhstanKenyaKoreaKuwaitLaosLatin AmericaLatviaLebanonLiberiaLithuaniaMalaysiaMexicoMicronesiaMiddle AfricaMoldovaMoroccoNepalNetherlandsNicaraguaNigeriaNorth AmericaNorth MacedoniaNorthern AfricaNorthern EuropeNorwayOceaniaPakistanPanamaPeruPhilippinesPolandPortugalRomaniaRussiaSaudi ArabiaScotlandSenegalSerbiaSierra LeoneSingaporeSomaliaSouth AfricaSouth AmericaSouth Central AsiaSouth Eastern AsiaSouthern EuropeSpainSri LankaSt. Vincent and the GrenadinesSudanSwedenSwitzerlandSyriaTaiwanThailandTrinidad and TobagoTurkeyUgandaUkraineUruguayUzbekistanVenezuelaVietnamWest IndiesWestern AfricaWestern AsiaWestern EuropeYemenZaireZimbabweAzores
Child Poverty Among Girls Under 16
Income
Poverty
Unemployment
Labor Participation
Family Structure
Vehicle Availability
Education Level
Disability

Child Poverty Among Girls Under 16 Comparison

Cajuns

Cubans

Tragic
Tragic
22.6%
CHILD POVERTY AMONG GIRLS UNDER 16
0.0/ 100
METRIC RATING
323rd/ 347
METRIC RANK
18.0%
CHILD POVERTY AMONG GIRLS UNDER 16
4.1/ 100
METRIC RATING
220th/ 347
METRIC RANK

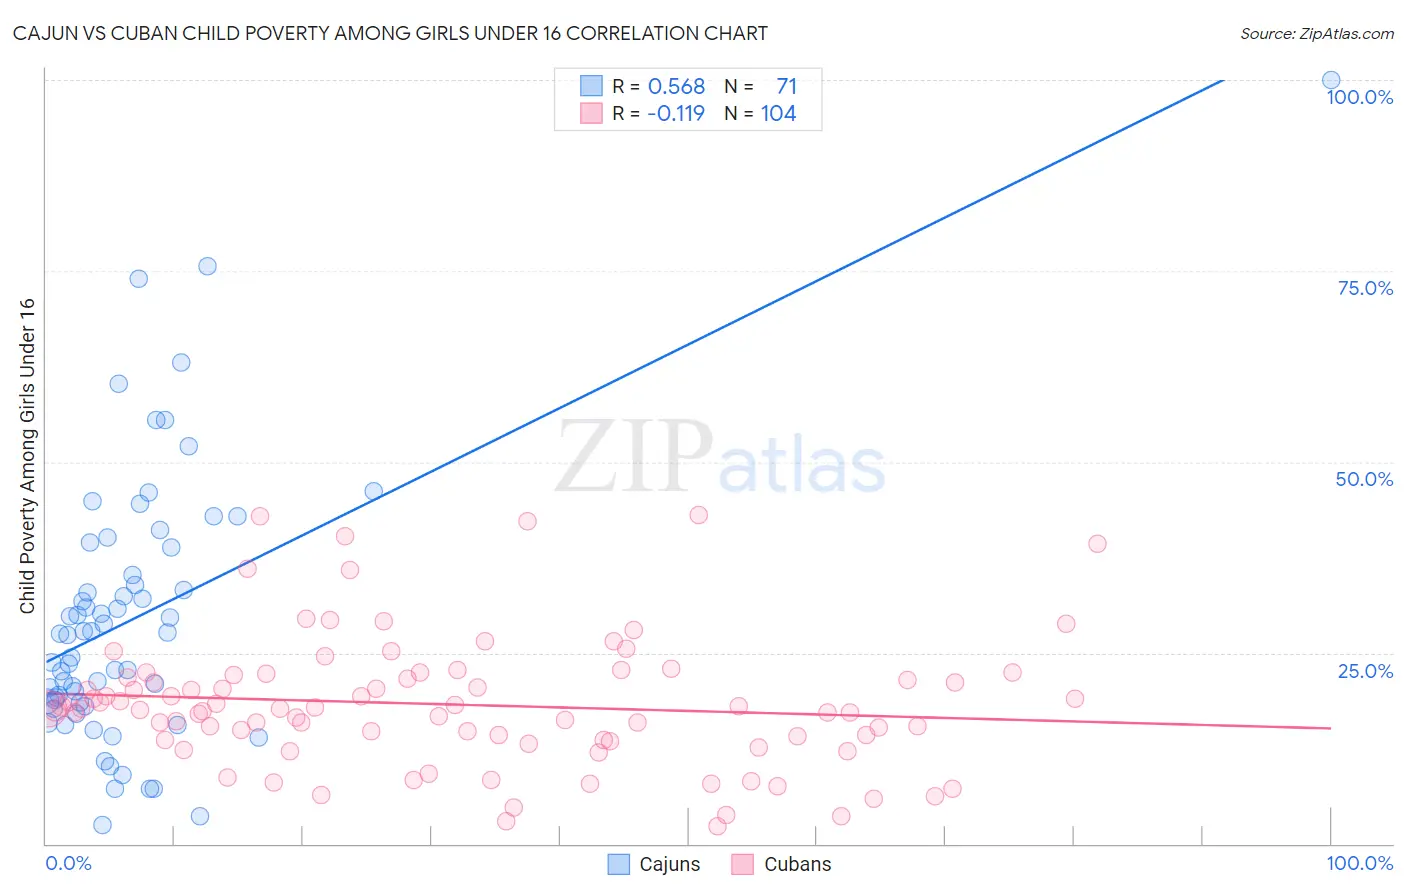
Cajun vs Cuban Child Poverty Among Girls Under 16 Correlation Chart

The statistical analysis conducted on geographies consisting of 148,672,718 people shows a substantial positive correlation between the proportion of Cajuns and poverty level among girls under the age of 16 in the United States with a correlation coefficient (R) of 0.568 and weighted average of 22.6%. Similarly, the statistical analysis conducted on geographies consisting of 440,192,797 people shows a poor negative correlation between the proportion of Cubans and poverty level among girls under the age of 16 in the United States with a correlation coefficient (R) of -0.119 and weighted average of 18.0%, a difference of 25.7%.
Cajun vs Cuban Child Poverty Among Girls Under 16

Child Poverty Among Girls Under 16 Correlation Summary

MeasurementCajunCuban
Minimum2.5%2.3%
Maximum100.0%43.1%
Range97.5%40.8%
Mean29.6%18.2%
Median27.5%17.6%
Interquartile 25% (IQ1)18.6%13.7%
Interquartile 75% (IQ3)38.9%21.9%
Interquartile Range (IQR)20.3%8.3%
Standard Deviation (Sample)17.7%8.5%
Standard Deviation (Population)17.6%8.5%

Similar Demographics by Child Poverty Among Girls Under 16

Demographics Similar to Cajuns by Child Poverty Among Girls Under 16

In terms of child poverty among girls under 16, the demographic groups most similar to Cajuns are Yakama (22.6%, a difference of 0.020%), Colville (22.5%, a difference of 0.21%), Paiute (22.6%, a difference of 0.29%), Immigrants from Congo (22.7%, a difference of 0.79%), and Immigrants from Honduras (22.8%, a difference of 0.92%).
DemographicsRating | RankChild Poverty Among Girls Under 16
Immigrants | Guatemala
0.0
/100
|
#316
Tragic
21.9%
Africans
0.0
/100
|
#317
Tragic
21.9%
Immigrants | Dominica
0.0
/100
|
#318
Tragic
22.1%
U.S. Virgin Islanders
0.0
/100
|
#319
Tragic
22.1%
Hondurans
0.0
/100
|
#320
Tragic
22.2%
Colville
0.0
/100
|
#321
Tragic
22.5%
Yakama
0.0
/100
|
#322
Tragic
22.6%
Cajuns
0.0
/100
|
#323
Tragic
22.6%
Paiute
0.0
/100
|
#324
Tragic
22.6%
Immigrants | Congo
0.0
/100
|
#325
Tragic
22.7%
Immigrants | Honduras
0.0
/100
|
#326
Tragic
22.8%
Central American Indians
0.0
/100
|
#327
Tragic
22.8%
Dominicans
0.0
/100
|
#328
Tragic
23.7%
Kiowa
0.0
/100
|
#329
Tragic
23.7%
Immigrants | Dominican Republic
0.0
/100
|
#330
Tragic
23.8%

Demographics Similar to Cubans by Child Poverty Among Girls Under 16

In terms of child poverty among girls under 16, the demographic groups most similar to Cubans are Immigrants from Panama (17.9%, a difference of 0.38%), Immigrants from Micronesia (18.0%, a difference of 0.43%), Alaska Native (17.8%, a difference of 0.62%), Japanese (17.8%, a difference of 0.72%), and Moroccan (17.8%, a difference of 0.80%).
DemographicsRating | RankChild Poverty Among Girls Under 16
Pennsylvania Germans
5.7
/100
|
#213
Tragic
17.8%
Malaysians
5.7
/100
|
#214
Tragic
17.8%
German Russians
5.7
/100
|
#215
Tragic
17.8%
Moroccans
5.5
/100
|
#216
Tragic
17.8%
Japanese
5.3
/100
|
#217
Tragic
17.8%
Alaska Natives
5.2
/100
|
#218
Tragic
17.8%
Immigrants | Panama
4.7
/100
|
#219
Tragic
17.9%
Cubans
4.1
/100
|
#220
Tragic
18.0%
Immigrants | Micronesia
3.5
/100
|
#221
Tragic
18.0%
Immigrants | Cambodia
2.9
/100
|
#222
Tragic
18.1%
Immigrants | Armenia
2.9
/100
|
#223
Tragic
18.1%
Bermudans
2.8
/100
|
#224
Tragic
18.1%
Immigrants | Africa
2.7
/100
|
#225
Tragic
18.2%
Nicaraguans
2.4
/100
|
#226
Tragic
18.2%
Immigrants | Nonimmigrants
2.0
/100
|
#227
Tragic
18.3%