Immigrants from El Salvador vs Immigrants from Somalia Poverty
COMPARE
Immigrants from El Salvador
Immigrants from Somalia
Poverty
Poverty Comparison
Immigrants from El Salvador
Immigrants from Somalia
14.3%
POVERTY
0.1/ 100
METRIC RATING
254th/ 347
METRIC RANK
15.8%
POVERTY
0.0/ 100
METRIC RATING
314th/ 347
METRIC RANK
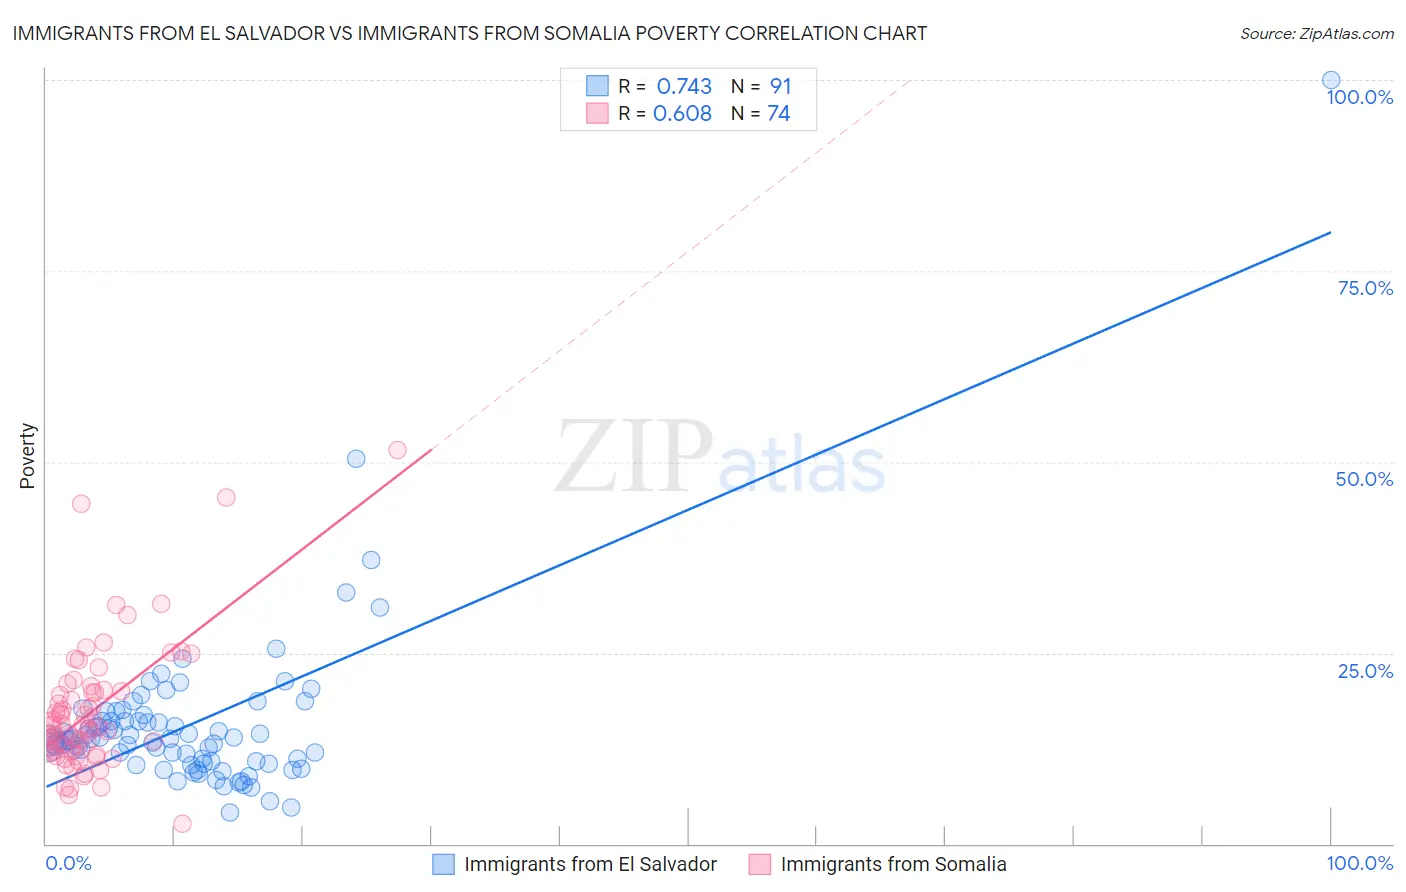
Immigrants from El Salvador vs Immigrants from Somalia Poverty Correlation Chart
The statistical analysis conducted on geographies consisting of 357,703,291 people shows a strong positive correlation between the proportion of Immigrants from El Salvador and poverty level in the United States with a correlation coefficient (R) of 0.743 and weighted average of 14.3%. Similarly, the statistical analysis conducted on geographies consisting of 92,107,608 people shows a significant positive correlation between the proportion of Immigrants from Somalia and poverty level in the United States with a correlation coefficient (R) of 0.608 and weighted average of 15.8%, a difference of 10.6%.
Poverty Correlation Summary
| Measurement | Immigrants from El Salvador | Immigrants from Somalia |
| Minimum | 4.1% | 2.7% |
| Maximum | 100.0% | 51.5% |
| Range | 95.9% | 48.8% |
| Mean | 15.6% | 17.3% |
| Median | 13.5% | 15.4% |
| Interquartile 25% (IQ1) | 10.8% | 12.1% |
| Interquartile 75% (IQ3) | 16.1% | 19.9% |
| Interquartile Range (IQR) | 5.3% | 7.8% |
| Standard Deviation (Sample) | 11.2% | 8.5% |
| Standard Deviation (Population) | 11.1% | 8.4% |
Similar Demographics by Poverty
Demographics Similar to Immigrants from El Salvador by Poverty
In terms of poverty, the demographic groups most similar to Immigrants from El Salvador are Immigrants from Ecuador (14.3%, a difference of 0.10%), Mexican American Indian (14.3%, a difference of 0.11%), Trinidadian and Tobagonian (14.3%, a difference of 0.16%), Ottawa (14.3%, a difference of 0.17%), and Immigrants from Trinidad and Tobago (14.2%, a difference of 0.25%).
| Demographics | Rating | Rank | Poverty |
| Liberians | 0.2 /100 | #247 | Tragic 14.1% |
| Immigrants | Western Africa | 0.2 /100 | #248 | Tragic 14.1% |
| Immigrants | Ghana | 0.2 /100 | #249 | Tragic 14.2% |
| Cree | 0.2 /100 | #250 | Tragic 14.2% |
| Immigrants | Burma/Myanmar | 0.2 /100 | #251 | Tragic 14.2% |
| Spanish American Indians | 0.2 /100 | #252 | Tragic 14.2% |
| Immigrants | Trinidad and Tobago | 0.2 /100 | #253 | Tragic 14.2% |
| Immigrants | El Salvador | 0.1 /100 | #254 | Tragic 14.3% |
| Immigrants | Ecuador | 0.1 /100 | #255 | Tragic 14.3% |
| Mexican American Indians | 0.1 /100 | #256 | Tragic 14.3% |
| Trinidadians and Tobagonians | 0.1 /100 | #257 | Tragic 14.3% |
| Ottawa | 0.1 /100 | #258 | Tragic 14.3% |
| Immigrants | Nicaragua | 0.1 /100 | #259 | Tragic 14.3% |
| Cape Verdeans | 0.1 /100 | #260 | Tragic 14.4% |
| Cherokee | 0.1 /100 | #261 | Tragic 14.4% |
Demographics Similar to Immigrants from Somalia by Poverty
In terms of poverty, the demographic groups most similar to Immigrants from Somalia are Immigrants from Grenada (15.8%, a difference of 0.12%), British West Indian (15.9%, a difference of 0.37%), Honduran (15.9%, a difference of 0.37%), Cajun (15.7%, a difference of 0.56%), and Chippewa (15.7%, a difference of 0.72%).
| Demographics | Rating | Rank | Poverty |
| Africans | 0.0 /100 | #307 | Tragic 15.6% |
| Choctaw | 0.0 /100 | #308 | Tragic 15.6% |
| Seminole | 0.0 /100 | #309 | Tragic 15.6% |
| Dutch West Indians | 0.0 /100 | #310 | Tragic 15.6% |
| Chippewa | 0.0 /100 | #311 | Tragic 15.7% |
| Cajuns | 0.0 /100 | #312 | Tragic 15.7% |
| Immigrants | Grenada | 0.0 /100 | #313 | Tragic 15.8% |
| Immigrants | Somalia | 0.0 /100 | #314 | Tragic 15.8% |
| British West Indians | 0.0 /100 | #315 | Tragic 15.9% |
| Hondurans | 0.0 /100 | #316 | Tragic 15.9% |
| U.S. Virgin Islanders | 0.0 /100 | #317 | Tragic 16.1% |
| Immigrants | Dominica | 0.0 /100 | #318 | Tragic 16.1% |
| Immigrants | Congo | 0.0 /100 | #319 | Tragic 16.1% |
| Immigrants | Honduras | 0.0 /100 | #320 | Tragic 16.2% |
| Arapaho | 0.0 /100 | #321 | Tragic 16.3% |