Immigrants from El Salvador vs Indonesian Poverty
COMPARE
Immigrants from El Salvador
Indonesian
Poverty
Poverty Comparison
Immigrants from El Salvador
Indonesians
14.3%
POVERTY
0.1/ 100
METRIC RATING
254th/ 347
METRIC RANK
15.1%
POVERTY
0.0/ 100
METRIC RATING
292nd/ 347
METRIC RANK
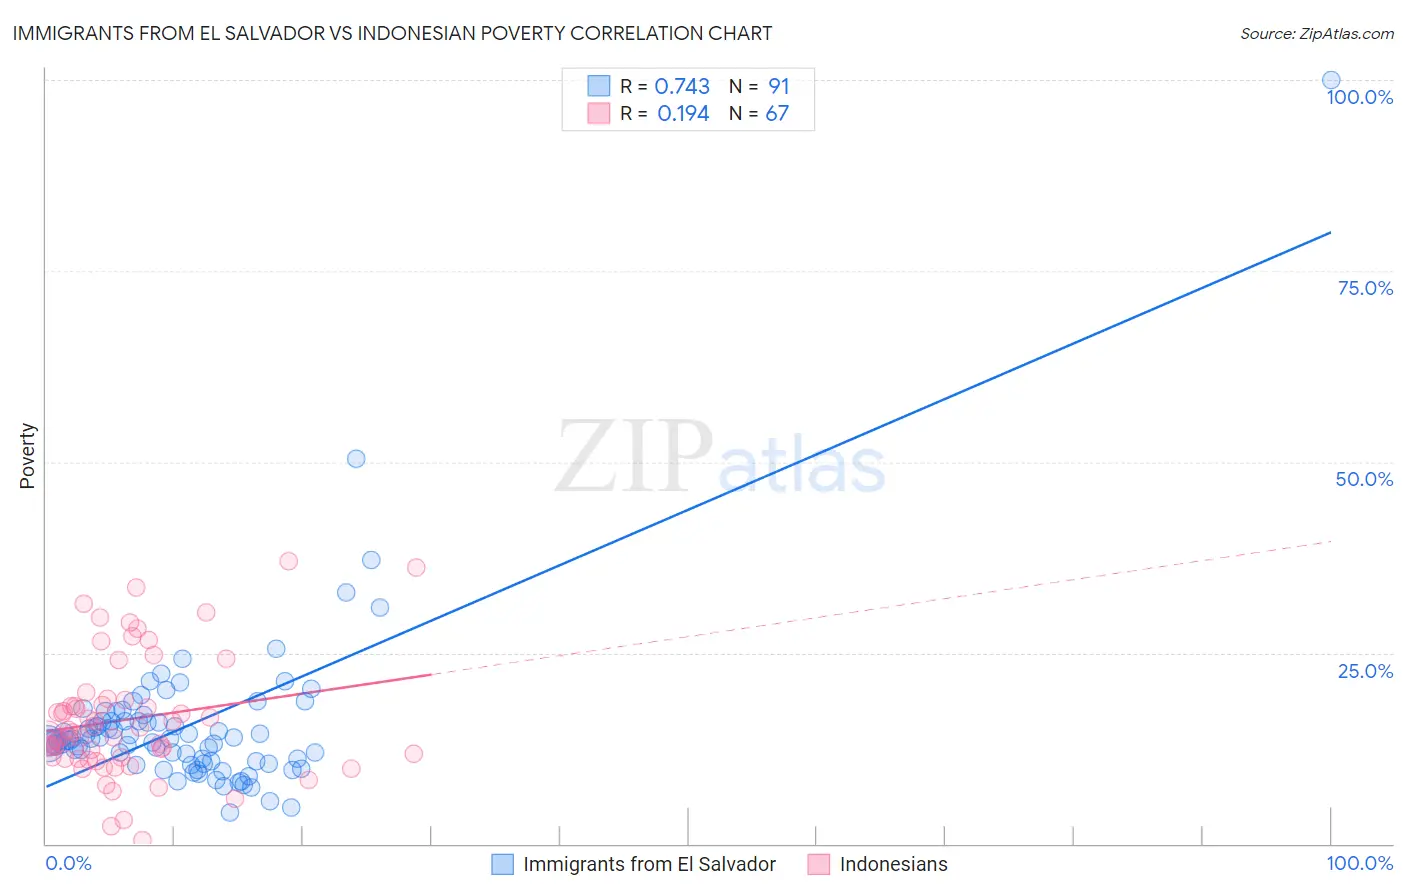
Immigrants from El Salvador vs Indonesian Poverty Correlation Chart
The statistical analysis conducted on geographies consisting of 357,703,291 people shows a strong positive correlation between the proportion of Immigrants from El Salvador and poverty level in the United States with a correlation coefficient (R) of 0.743 and weighted average of 14.3%. Similarly, the statistical analysis conducted on geographies consisting of 162,655,405 people shows a poor positive correlation between the proportion of Indonesians and poverty level in the United States with a correlation coefficient (R) of 0.194 and weighted average of 15.1%, a difference of 5.9%.
Poverty Correlation Summary
| Measurement | Immigrants from El Salvador | Indonesian |
| Minimum | 4.1% | 0.56% |
| Maximum | 100.0% | 37.0% |
| Range | 95.9% | 36.5% |
| Mean | 15.6% | 16.3% |
| Median | 13.5% | 14.6% |
| Interquartile 25% (IQ1) | 10.8% | 11.1% |
| Interquartile 75% (IQ3) | 16.1% | 18.9% |
| Interquartile Range (IQR) | 5.3% | 7.8% |
| Standard Deviation (Sample) | 11.2% | 7.9% |
| Standard Deviation (Population) | 11.1% | 7.9% |
Similar Demographics by Poverty
Demographics Similar to Immigrants from El Salvador by Poverty
In terms of poverty, the demographic groups most similar to Immigrants from El Salvador are Immigrants from Ecuador (14.3%, a difference of 0.10%), Mexican American Indian (14.3%, a difference of 0.11%), Trinidadian and Tobagonian (14.3%, a difference of 0.16%), Ottawa (14.3%, a difference of 0.17%), and Immigrants from Trinidad and Tobago (14.2%, a difference of 0.25%).
| Demographics | Rating | Rank | Poverty |
| Liberians | 0.2 /100 | #247 | Tragic 14.1% |
| Immigrants | Western Africa | 0.2 /100 | #248 | Tragic 14.1% |
| Immigrants | Ghana | 0.2 /100 | #249 | Tragic 14.2% |
| Cree | 0.2 /100 | #250 | Tragic 14.2% |
| Immigrants | Burma/Myanmar | 0.2 /100 | #251 | Tragic 14.2% |
| Spanish American Indians | 0.2 /100 | #252 | Tragic 14.2% |
| Immigrants | Trinidad and Tobago | 0.2 /100 | #253 | Tragic 14.2% |
| Immigrants | El Salvador | 0.1 /100 | #254 | Tragic 14.3% |
| Immigrants | Ecuador | 0.1 /100 | #255 | Tragic 14.3% |
| Mexican American Indians | 0.1 /100 | #256 | Tragic 14.3% |
| Trinidadians and Tobagonians | 0.1 /100 | #257 | Tragic 14.3% |
| Ottawa | 0.1 /100 | #258 | Tragic 14.3% |
| Immigrants | Nicaragua | 0.1 /100 | #259 | Tragic 14.3% |
| Cape Verdeans | 0.1 /100 | #260 | Tragic 14.4% |
| Cherokee | 0.1 /100 | #261 | Tragic 14.4% |
Demographics Similar to Indonesians by Poverty
In terms of poverty, the demographic groups most similar to Indonesians are Immigrants from Zaire (15.1%, a difference of 0.010%), Immigrants from Cabo Verde (15.1%, a difference of 0.050%), Mexican (15.1%, a difference of 0.18%), Immigrants from Belize (15.1%, a difference of 0.28%), and Yaqui (15.1%, a difference of 0.40%).
| Demographics | Rating | Rank | Poverty |
| Vietnamese | 0.0 /100 | #285 | Tragic 15.0% |
| Immigrants | Latin America | 0.0 /100 | #286 | Tragic 15.0% |
| Inupiat | 0.0 /100 | #287 | Tragic 15.1% |
| Yaqui | 0.0 /100 | #288 | Tragic 15.1% |
| Immigrants | Belize | 0.0 /100 | #289 | Tragic 15.1% |
| Mexicans | 0.0 /100 | #290 | Tragic 15.1% |
| Immigrants | Cabo Verde | 0.0 /100 | #291 | Tragic 15.1% |
| Indonesians | 0.0 /100 | #292 | Tragic 15.1% |
| Immigrants | Zaire | 0.0 /100 | #293 | Tragic 15.1% |
| Blackfeet | 0.0 /100 | #294 | Tragic 15.2% |
| Guatemalans | 0.0 /100 | #295 | Tragic 15.3% |
| Hispanics or Latinos | 0.0 /100 | #296 | Tragic 15.3% |
| Immigrants | Bangladesh | 0.0 /100 | #297 | Tragic 15.3% |
| Immigrants | Senegal | 0.0 /100 | #298 | Tragic 15.3% |
| Senegalese | 0.0 /100 | #299 | Tragic 15.3% |