Immigrants from Cuba vs Armenian Child Poverty Among Girls Under 16
COMPARE
Immigrants from Cuba
Armenian
Child Poverty Among Girls Under 16
Child Poverty Among Girls Under 16 Comparison
Immigrants from Cuba
Armenians
18.8%
CHILD POVERTY AMONG GIRLS UNDER 16
0.7/ 100
METRIC RATING
242nd/ 347
METRIC RANK
15.5%
CHILD POVERTY AMONG GIRLS UNDER 16
87.9/ 100
METRIC RATING
139th/ 347
METRIC RANK
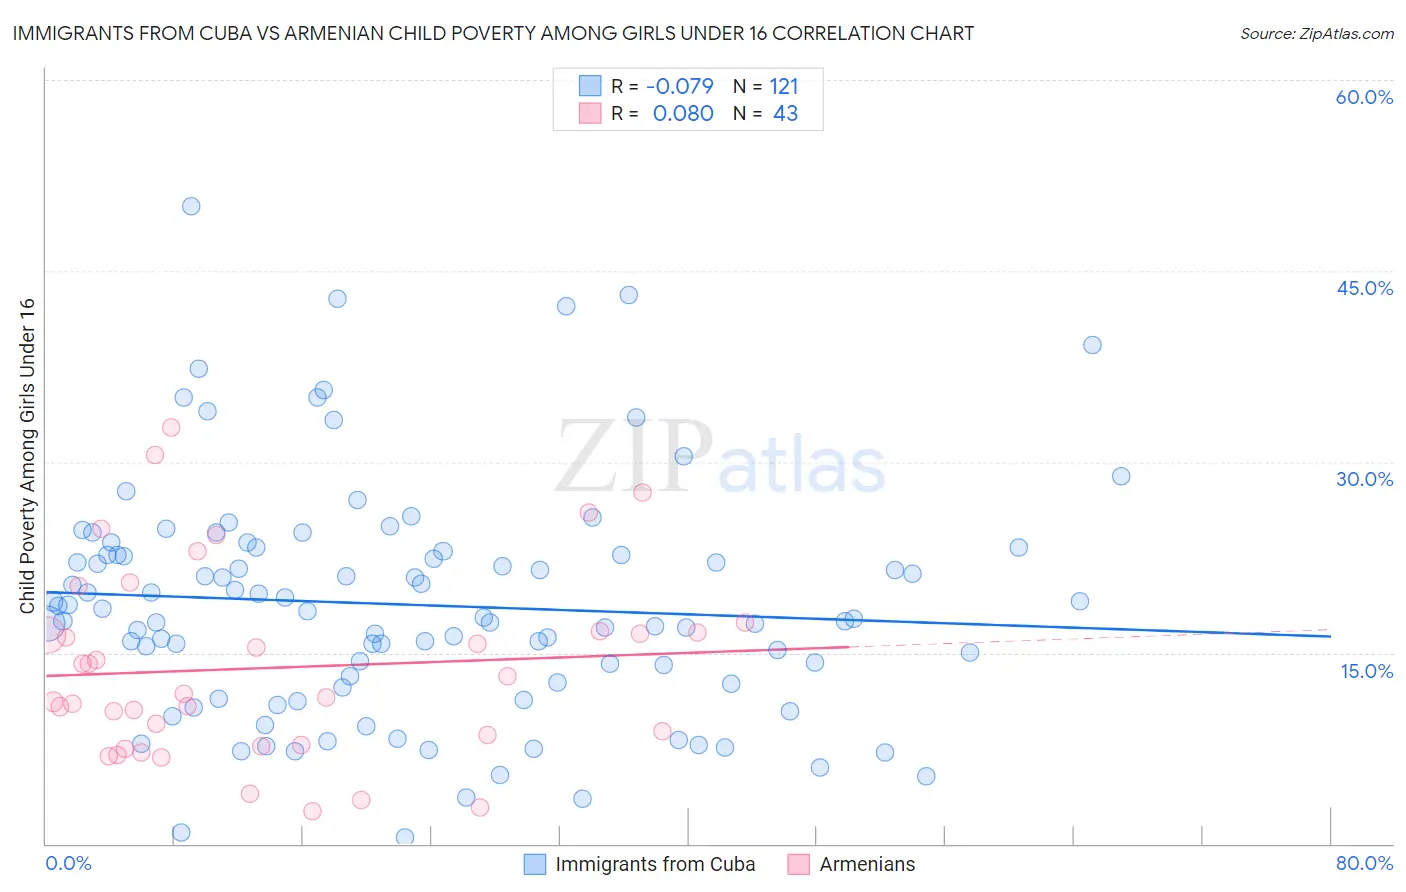
Immigrants from Cuba vs Armenian Child Poverty Among Girls Under 16 Correlation Chart
The statistical analysis conducted on geographies consisting of 321,897,720 people shows a slight negative correlation between the proportion of Immigrants from Cuba and poverty level among girls under the age of 16 in the United States with a correlation coefficient (R) of -0.079 and weighted average of 18.8%. Similarly, the statistical analysis conducted on geographies consisting of 304,744,941 people shows a slight positive correlation between the proportion of Armenians and poverty level among girls under the age of 16 in the United States with a correlation coefficient (R) of 0.080 and weighted average of 15.5%, a difference of 21.0%.
Child Poverty Among Girls Under 16 Correlation Summary
| Measurement | Immigrants from Cuba | Armenian |
| Minimum | 0.48% | 2.6% |
| Maximum | 50.1% | 32.7% |
| Range | 49.6% | 30.1% |
| Mean | 18.8% | 13.8% |
| Median | 17.8% | 11.7% |
| Interquartile 25% (IQ1) | 12.6% | 7.7% |
| Interquartile 75% (IQ3) | 22.9% | 16.7% |
| Interquartile Range (IQR) | 10.2% | 9.0% |
| Standard Deviation (Sample) | 9.2% | 7.4% |
| Standard Deviation (Population) | 9.1% | 7.3% |
Similar Demographics by Child Poverty Among Girls Under 16
Demographics Similar to Immigrants from Cuba by Child Poverty Among Girls Under 16
In terms of child poverty among girls under 16, the demographic groups most similar to Immigrants from Cuba are American (18.8%, a difference of 0.14%), Immigrants from Nicaragua (18.8%, a difference of 0.22%), Ecuadorian (18.8%, a difference of 0.28%), Shoshone (18.9%, a difference of 0.40%), and Immigrants from Laos (18.9%, a difference of 0.43%).
| Demographics | Rating | Rank | Child Poverty Among Girls Under 16 |
| Nepalese | 1.1 /100 | #235 | Tragic 18.6% |
| Alsatians | 1.1 /100 | #236 | Tragic 18.6% |
| Immigrants | Nigeria | 1.0 /100 | #237 | Tragic 18.6% |
| Immigrants | Eritrea | 1.0 /100 | #238 | Tragic 18.7% |
| Marshallese | 0.9 /100 | #239 | Tragic 18.7% |
| Nigerians | 0.9 /100 | #240 | Tragic 18.7% |
| Americans | 0.8 /100 | #241 | Tragic 18.8% |
| Immigrants | Cuba | 0.7 /100 | #242 | Tragic 18.8% |
| Immigrants | Nicaragua | 0.7 /100 | #243 | Tragic 18.8% |
| Ecuadorians | 0.7 /100 | #244 | Tragic 18.8% |
| Shoshone | 0.6 /100 | #245 | Tragic 18.9% |
| Immigrants | Laos | 0.6 /100 | #246 | Tragic 18.9% |
| Immigrants | Ghana | 0.5 /100 | #247 | Tragic 18.9% |
| French American Indians | 0.3 /100 | #248 | Tragic 19.2% |
| Potawatomi | 0.3 /100 | #249 | Tragic 19.2% |
Demographics Similar to Armenians by Child Poverty Among Girls Under 16
In terms of child poverty among girls under 16, the demographic groups most similar to Armenians are Immigrants from Vietnam (15.5%, a difference of 0.10%), New Zealander (15.6%, a difference of 0.18%), Immigrants from Jordan (15.6%, a difference of 0.19%), Canadian (15.6%, a difference of 0.21%), and South African (15.5%, a difference of 0.23%).
| Demographics | Rating | Rank | Child Poverty Among Girls Under 16 |
| Mongolians | 89.7 /100 | #132 | Excellent 15.4% |
| Brazilians | 89.6 /100 | #133 | Excellent 15.4% |
| Immigrants | Spain | 89.1 /100 | #134 | Excellent 15.5% |
| Czechoslovakians | 89.0 /100 | #135 | Excellent 15.5% |
| Native Hawaiians | 89.0 /100 | #136 | Excellent 15.5% |
| South Africans | 88.7 /100 | #137 | Excellent 15.5% |
| Immigrants | Vietnam | 88.2 /100 | #138 | Excellent 15.5% |
| Armenians | 87.9 /100 | #139 | Excellent 15.5% |
| New Zealanders | 87.2 /100 | #140 | Excellent 15.6% |
| Immigrants | Jordan | 87.2 /100 | #141 | Excellent 15.6% |
| Canadians | 87.1 /100 | #142 | Excellent 15.6% |
| Immigrants | Peru | 86.6 /100 | #143 | Excellent 15.6% |
| Israelis | 86.3 /100 | #144 | Excellent 15.6% |
| Welsh | 85.4 /100 | #145 | Excellent 15.6% |
| Samoans | 84.2 /100 | #146 | Excellent 15.7% |