Immigrants from Cabo Verde vs Korean Child Poverty Among Boys Under 16
COMPARE
Immigrants from Cabo Verde
Korean
Child Poverty Among Boys Under 16
Child Poverty Among Boys Under 16 Comparison
Immigrants from Cabo Verde
Koreans
19.7%
CHILD POVERTY AMONG BOYS UNDER 16
0.1/ 100
METRIC RATING
269th/ 347
METRIC RANK
14.0%
CHILD POVERTY AMONG BOYS UNDER 16
99.6/ 100
METRIC RATING
42nd/ 347
METRIC RANK
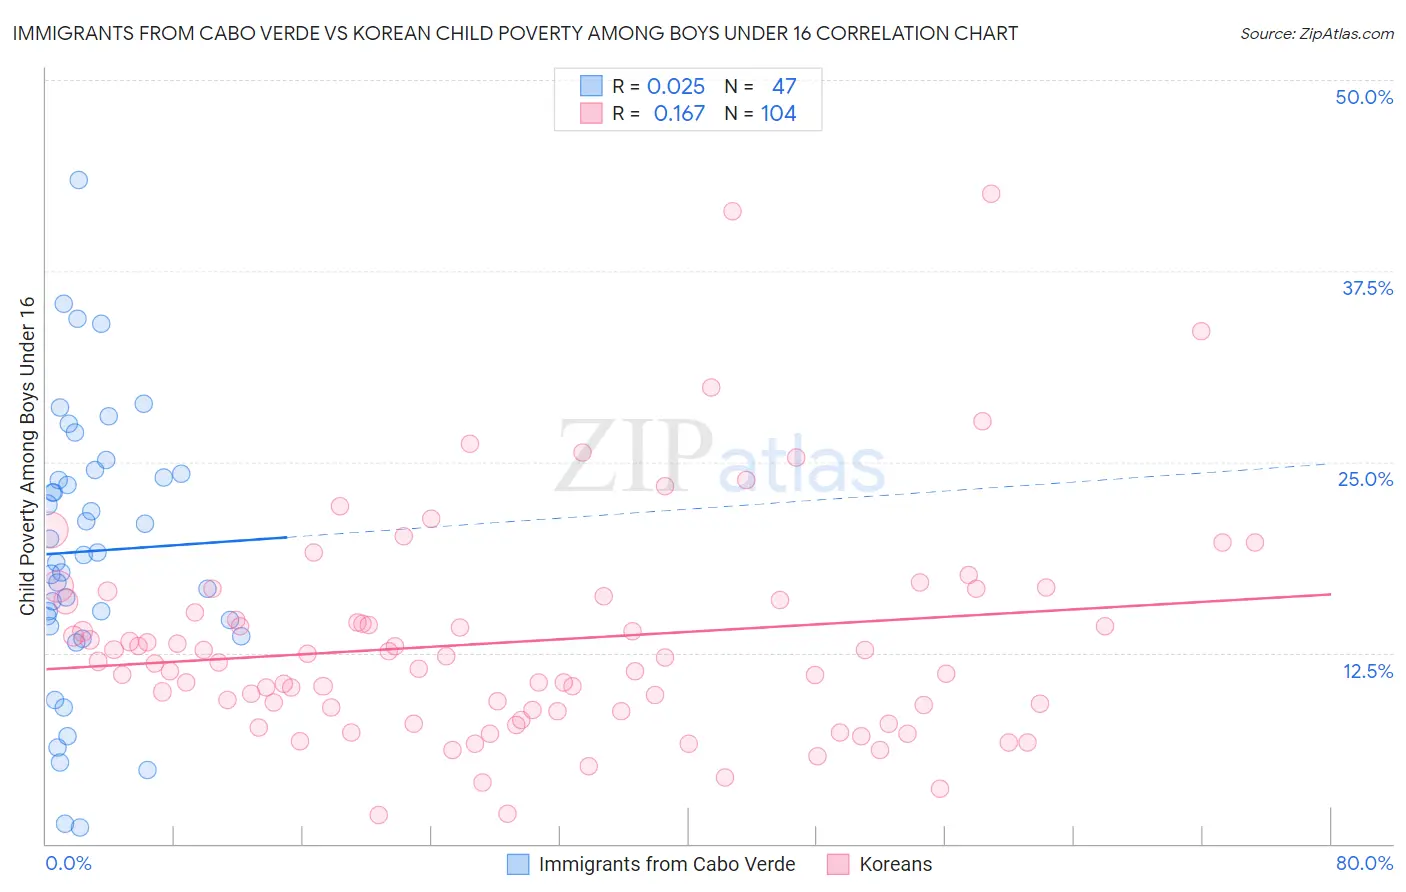
Immigrants from Cabo Verde vs Korean Child Poverty Among Boys Under 16 Correlation Chart
The statistical analysis conducted on geographies consisting of 37,877,952 people shows no correlation between the proportion of Immigrants from Cabo Verde and poverty level among boys under the age of 16 in the United States with a correlation coefficient (R) of 0.025 and weighted average of 19.7%. Similarly, the statistical analysis conducted on geographies consisting of 498,598,673 people shows a poor positive correlation between the proportion of Koreans and poverty level among boys under the age of 16 in the United States with a correlation coefficient (R) of 0.167 and weighted average of 14.0%, a difference of 40.8%.
Child Poverty Among Boys Under 16 Correlation Summary
| Measurement | Immigrants from Cabo Verde | Korean |
| Minimum | 1.0% | 1.9% |
| Maximum | 43.4% | 42.6% |
| Range | 42.4% | 40.6% |
| Mean | 19.1% | 13.2% |
| Median | 18.9% | 11.9% |
| Interquartile 25% (IQ1) | 14.2% | 8.7% |
| Interquartile 75% (IQ3) | 24.2% | 15.9% |
| Interquartile Range (IQR) | 10.0% | 7.2% |
| Standard Deviation (Sample) | 8.9% | 7.2% |
| Standard Deviation (Population) | 8.8% | 7.1% |
Similar Demographics by Child Poverty Among Boys Under 16
Demographics Similar to Immigrants from Cabo Verde by Child Poverty Among Boys Under 16
In terms of child poverty among boys under 16, the demographic groups most similar to Immigrants from Cabo Verde are Spanish American Indian (19.6%, a difference of 0.16%), Vietnamese (19.6%, a difference of 0.27%), Cherokee (19.7%, a difference of 0.28%), Immigrants from El Salvador (19.6%, a difference of 0.29%), and Guyanese (19.6%, a difference of 0.33%).
| Demographics | Rating | Rank | Child Poverty Among Boys Under 16 |
| Immigrants | Guyana | 0.1 /100 | #262 | Tragic 19.5% |
| Ottawa | 0.1 /100 | #263 | Tragic 19.5% |
| Iroquois | 0.1 /100 | #264 | Tragic 19.6% |
| Guyanese | 0.1 /100 | #265 | Tragic 19.6% |
| Immigrants | El Salvador | 0.1 /100 | #266 | Tragic 19.6% |
| Vietnamese | 0.1 /100 | #267 | Tragic 19.6% |
| Spanish American Indians | 0.1 /100 | #268 | Tragic 19.6% |
| Immigrants | Cabo Verde | 0.1 /100 | #269 | Tragic 19.7% |
| Cherokee | 0.1 /100 | #270 | Tragic 19.7% |
| Chickasaw | 0.1 /100 | #271 | Tragic 19.8% |
| Immigrants | Ecuador | 0.1 /100 | #272 | Tragic 19.8% |
| Belizeans | 0.1 /100 | #273 | Tragic 19.9% |
| Immigrants | Bangladesh | 0.0 /100 | #274 | Tragic 19.9% |
| Jamaicans | 0.0 /100 | #275 | Tragic 20.0% |
| Sub-Saharan Africans | 0.0 /100 | #276 | Tragic 20.0% |
Demographics Similar to Koreans by Child Poverty Among Boys Under 16
In terms of child poverty among boys under 16, the demographic groups most similar to Koreans are Lithuanian (14.0%, a difference of 0.030%), Immigrants from Asia (13.9%, a difference of 0.11%), Immigrants from Australia (13.9%, a difference of 0.36%), Immigrants from Northern Europe (13.9%, a difference of 0.49%), and Croatian (14.0%, a difference of 0.50%).
| Demographics | Rating | Rank | Child Poverty Among Boys Under 16 |
| Russians | 99.7 /100 | #35 | Exceptional 13.8% |
| Luxembourgers | 99.7 /100 | #36 | Exceptional 13.8% |
| Immigrants | Sri Lanka | 99.6 /100 | #37 | Exceptional 13.9% |
| Immigrants | Northern Europe | 99.6 /100 | #38 | Exceptional 13.9% |
| Immigrants | Australia | 99.6 /100 | #39 | Exceptional 13.9% |
| Immigrants | Asia | 99.6 /100 | #40 | Exceptional 13.9% |
| Lithuanians | 99.6 /100 | #41 | Exceptional 14.0% |
| Koreans | 99.6 /100 | #42 | Exceptional 14.0% |
| Croatians | 99.5 /100 | #43 | Exceptional 14.0% |
| Estonians | 99.4 /100 | #44 | Exceptional 14.1% |
| Immigrants | Scotland | 99.4 /100 | #45 | Exceptional 14.1% |
| Greeks | 99.4 /100 | #46 | Exceptional 14.1% |
| Immigrants | Moldova | 99.4 /100 | #47 | Exceptional 14.1% |
| Immigrants | Indonesia | 99.4 /100 | #48 | Exceptional 14.1% |
| Czechs | 99.3 /100 | #49 | Exceptional 14.1% |