Immigrants from West Indies vs Korean Child Poverty Among Boys Under 16

COMPARE

Immigrants from West Indies
Race
Ancestry
AfghanAfricanAlaska NativeAlaskan AthabascanAlbanianAleutAlsatianAmericanApacheArabArapahoArgentineanArmenianAssyrian/Chaldean/SyriacAustralianAustrianBahamianBangladeshiBarbadianBasqueBelgianBelizeanBermudanBhutaneseBlackfeetBolivianBrazilianBritishBritish West IndianBulgarianBurmeseCajunCambodianCanadianCape VerdeanCarpatho RusynCelticCentral AmericanCentral American IndianCherokeeCheyenneChickasawChileanChineseChippewaChoctawColombianColvilleComancheCosta RicanCreeCreekCroatianCrowCubanCypriotCzechCzechoslovakianDanishDelawareDominicanDutchDutch West IndianEastern EuropeanEcuadorianEgyptianEnglishEstonianEthiopianEuropeanFijianFilipinoFinnishFrenchFrench American IndianFrench CanadianGermanGerman RussianGhanaianGreekGuamanian/ChamorroGuatemalanGuyaneseHaitianHmongHonduranHopiHoumaHungarianIcelanderIndian (Asian)IndonesianInupiatIranianIraqiIrishIroquoisIsraeliItalianJamaicanJapaneseJordanianKenyanKiowaLaotianLatvianLebaneseLiberianLithuanianLumbeeLuxembourgerMacedonianMalaysianMalteseMarshalleseMenomineeMexicanMexican American IndianMongolianMoroccanNative HawaiianNavajoNepaleseNew ZealanderNicaraguanNigerianNorthern EuropeanNorwegianOkinawanOsageOttawaPaiutePakistaniPalestinianPanamanianParaguayanPennsylvania GermanPeruvianPimaPolishPortuguesePotawatomiPuebloPuerto RicanPuget Sound SalishRomanianRussianSalvadoranSamoanScandinavianScotch-IrishScottishSeminoleSenegaleseSerbianShoshoneSierra LeoneanSiouxSlavicSlovakSloveneSomaliSouth AfricanSouth AmericanSouth American IndianSoviet UnionSpaniardSpanishSpanish AmericanSpanish American IndianSri LankanSubsaharan AfricanSudaneseSwedishSwissSyrianTaiwaneseThaiTlingit-HaidaTohono O'OdhamTonganTrinidadian and TobagonianTsimshianTurkishU.S. Virgin IslanderUgandanUkrainianUruguayanUteVenezuelanVietnameseWelshWest IndianYakamaYaquiYugoslavianYumanYup'ikZimbabwean
Immigration
NonimmigrantsImmigrantsAfghanistanAfricaAlbaniaArgentinaArmeniaAsiaAustraliaAustriaBahamasBangladeshBarbadosBelarusBelgiumBelizeBoliviaBosnia and HerzegovinaBrazilBulgariaBurma/MyanmarCabo VerdeCambodiaCameroonCanadaCaribbeanCentral AmericaChileChinaColombiaCongoCosta RicaCroatiaCubaCzechoslovakiaDenmarkDominicaDominican RepublicEastern AfricaEastern AsiaEastern EuropeEcuadorEgyptEl SalvadorEnglandEritreaEthiopiaEuropeFijiFranceGermanyGhanaGreeceGrenadaGuatemalaGuyanaHaitiHondurasHong KongHungaryIndiaIndonesiaIranIraqIrelandIsraelItalyJamaicaJapanJordanKazakhstanKenyaKoreaKuwaitLaosLatin AmericaLatviaLebanonLiberiaLithuaniaMalaysiaMexicoMicronesiaMiddle AfricaMoldovaMoroccoNepalNetherlandsNicaraguaNigeriaNorth AmericaNorth MacedoniaNorthern AfricaNorthern EuropeNorwayOceaniaPakistanPanamaPeruPhilippinesPolandPortugalRomaniaRussiaSaudi ArabiaScotlandSenegalSerbiaSierra LeoneSingaporeSomaliaSouth AfricaSouth AmericaSouth Central AsiaSouth Eastern AsiaSouthern EuropeSpainSri LankaSt. Vincent and the GrenadinesSudanSwedenSwitzerlandSyriaTaiwanThailandTrinidad and TobagoTurkeyUgandaUkraineUruguayUzbekistanVenezuelaVietnamWest IndiesWestern AfricaWestern AsiaWestern EuropeYemenZaireZimbabweAzores
Korean
Race
Ancestry
AfghanAfricanAlaska NativeAlaskan AthabascanAlbanianAleutAlsatianAmericanApacheArabArapahoArgentineanArmenianAssyrian/Chaldean/SyriacAustralianAustrianBahamianBangladeshiBarbadianBasqueBelgianBelizeanBermudanBhutaneseBlackfeetBolivianBrazilianBritishBritish West IndianBulgarianBurmeseCajunCambodianCanadianCape VerdeanCarpatho RusynCelticCentral AmericanCentral American IndianCherokeeCheyenneChickasawChileanChineseChippewaChoctawColombianColvilleComancheCosta RicanCreeCreekCroatianCrowCubanCypriotCzechCzechoslovakianDanishDelawareDominicanDutchDutch West IndianEastern EuropeanEcuadorianEgyptianEnglishEstonianEthiopianEuropeanFijianFilipinoFinnishFrenchFrench American IndianFrench CanadianGermanGerman RussianGhanaianGreekGuamanian/ChamorroGuatemalanGuyaneseHaitianHmongHonduranHopiHoumaHungarianIcelanderIndian (Asian)IndonesianInupiatIranianIraqiIrishIroquoisIsraeliItalianJamaicanJapaneseJordanianKenyanKiowaKoreanLaotianLatvianLebaneseLiberianLithuanianLumbeeLuxembourgerMacedonianMalaysianMalteseMarshalleseMenomineeMexicanMexican American IndianMongolianMoroccanNative HawaiianNavajoNepaleseNew ZealanderNicaraguanNigerianNorthern EuropeanNorwegianOkinawanOsageOttawaPaiutePakistaniPalestinianPanamanianParaguayanPennsylvania GermanPeruvianPimaPolishPortuguesePotawatomiPuebloPuerto RicanPuget Sound SalishRomanianRussianSalvadoranSamoanScandinavianScotch-IrishScottishSeminoleSenegaleseSerbianShoshoneSierra LeoneanSiouxSlavicSlovakSloveneSomaliSouth AfricanSouth AmericanSouth American IndianSoviet UnionSpaniardSpanishSpanish AmericanSpanish American IndianSri LankanSubsaharan AfricanSudaneseSwedishSwissSyrianTaiwaneseThaiTlingit-HaidaTohono O'OdhamTonganTrinidadian and TobagonianTsimshianTurkishU.S. Virgin IslanderUgandanUkrainianUruguayanUteVenezuelanVietnameseWelshWest IndianYakamaYaquiYugoslavianYumanYup'ikZimbabwean
Immigration
NonimmigrantsImmigrantsAfghanistanAfricaAlbaniaArgentinaArmeniaAsiaAustraliaAustriaBahamasBangladeshBarbadosBelarusBelgiumBelizeBoliviaBosnia and HerzegovinaBrazilBulgariaBurma/MyanmarCabo VerdeCambodiaCameroonCanadaCaribbeanCentral AmericaChileChinaColombiaCongoCosta RicaCroatiaCubaCzechoslovakiaDenmarkDominicaDominican RepublicEastern AfricaEastern AsiaEastern EuropeEcuadorEgyptEl SalvadorEnglandEritreaEthiopiaEuropeFijiFranceGermanyGhanaGreeceGrenadaGuatemalaGuyanaHaitiHondurasHong KongHungaryIndiaIndonesiaIranIraqIrelandIsraelItalyJamaicaJapanJordanKazakhstanKenyaKoreaKuwaitLaosLatin AmericaLatviaLebanonLiberiaLithuaniaMalaysiaMexicoMicronesiaMiddle AfricaMoldovaMoroccoNepalNetherlandsNicaraguaNigeriaNorth AmericaNorth MacedoniaNorthern AfricaNorthern EuropeNorwayOceaniaPakistanPanamaPeruPhilippinesPolandPortugalRomaniaRussiaSaudi ArabiaScotlandSenegalSerbiaSierra LeoneSingaporeSomaliaSouth AfricaSouth AmericaSouth Central AsiaSouth Eastern AsiaSouthern EuropeSpainSri LankaSt. Vincent and the GrenadinesSudanSwedenSwitzerlandSyriaTaiwanThailandTrinidad and TobagoTurkeyUgandaUkraineUruguayUzbekistanVenezuelaVietnamWestern AfricaWestern AsiaWestern EuropeYemenZaireZimbabweAzores
Child Poverty Among Boys Under 16
Income
Poverty
Unemployment
Labor Participation
Family Structure
Vehicle Availability
Education Level
Disability

Child Poverty Among Boys Under 16 Comparison

Immigrants from West Indies

Koreans

Tragic
Exceptional
20.0%
CHILD POVERTY AMONG BOYS UNDER 16
0.0/ 100
METRIC RATING
278th/ 347
METRIC RANK
14.0%
CHILD POVERTY AMONG BOYS UNDER 16
99.6/ 100
METRIC RATING
42nd/ 347
METRIC RANK

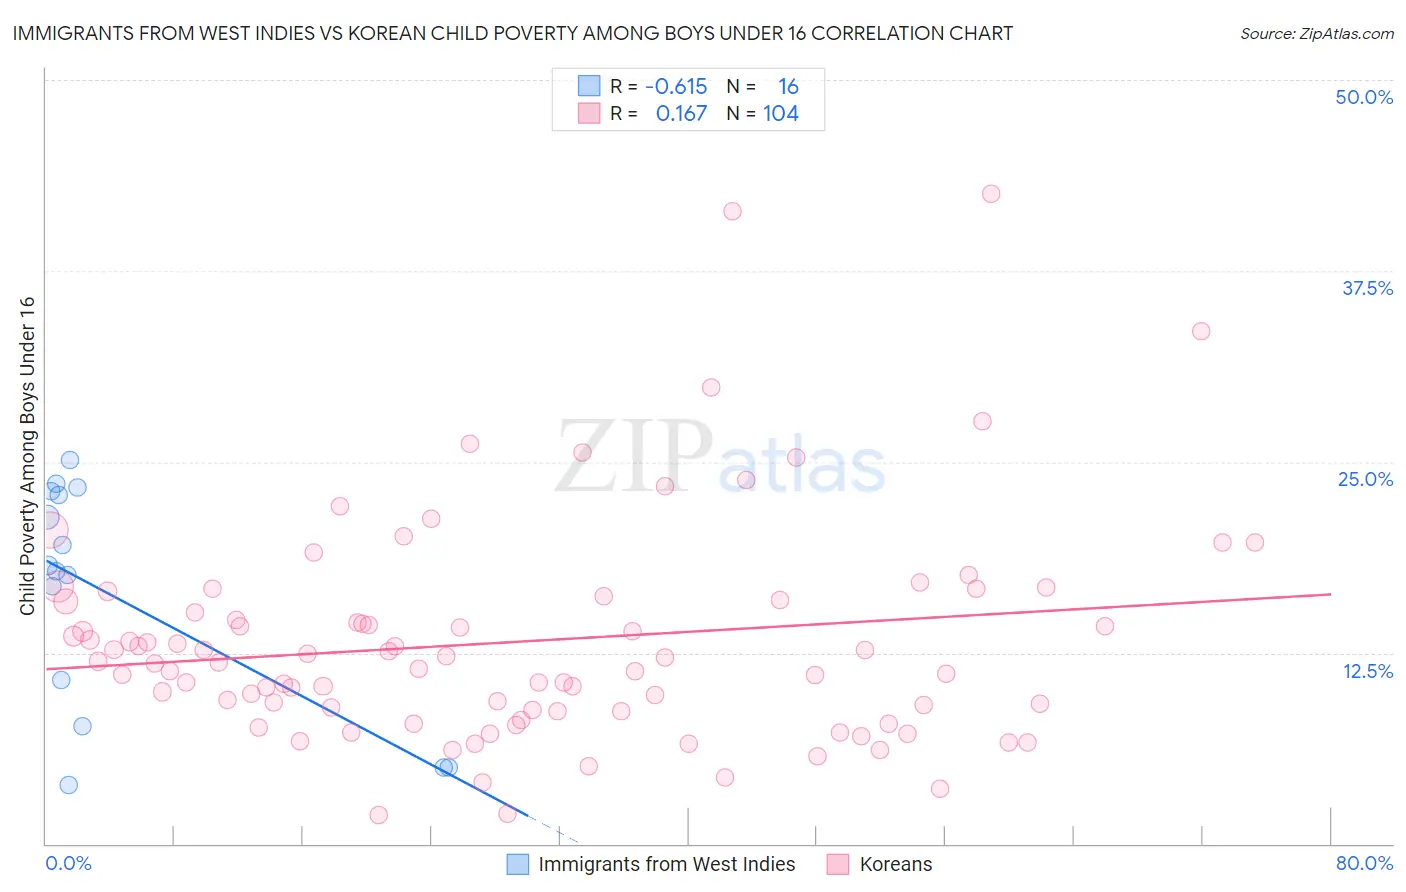
Immigrants from West Indies vs Korean Child Poverty Among Boys Under 16 Correlation Chart

The statistical analysis conducted on geographies consisting of 72,283,837 people shows a significant negative correlation between the proportion of Immigrants from West Indies and poverty level among boys under the age of 16 in the United States with a correlation coefficient (R) of -0.615 and weighted average of 20.0%. Similarly, the statistical analysis conducted on geographies consisting of 498,598,673 people shows a poor positive correlation between the proportion of Koreans and poverty level among boys under the age of 16 in the United States with a correlation coefficient (R) of 0.167 and weighted average of 14.0%, a difference of 43.4%.
Immigrants from West Indies vs Korean Child Poverty Among Boys Under 16

Child Poverty Among Boys Under 16 Correlation Summary

MeasurementImmigrants from West IndiesKorean
Minimum3.9%1.9%
Maximum25.1%42.6%
Range21.2%40.6%
Mean16.3%13.2%
Median18.0%11.9%
Interquartile 25% (IQ1)9.2%8.7%
Interquartile 75% (IQ3)22.9%15.9%
Interquartile Range (IQR)13.8%7.2%
Standard Deviation (Sample)7.4%7.2%
Standard Deviation (Population)7.2%7.1%

Similar Demographics by Child Poverty Among Boys Under 16

Demographics Similar to Immigrants from West Indies by Child Poverty Among Boys Under 16

In terms of child poverty among boys under 16, the demographic groups most similar to Immigrants from West Indies are Immigrants from Barbados (20.0%, a difference of 0.020%), Subsaharan African (20.0%, a difference of 0.12%), Bangladeshi (20.0%, a difference of 0.13%), Central American (20.1%, a difference of 0.25%), and Jamaican (20.0%, a difference of 0.29%).
DemographicsRating | RankChild Poverty Among Boys Under 16
Chickasaw
0.1
/100
|
#271
Tragic
19.8%
Immigrants | Ecuador
0.1
/100
|
#272
Tragic
19.8%
Belizeans
0.1
/100
|
#273
Tragic
19.9%
Immigrants | Bangladesh
0.0
/100
|
#274
Tragic
19.9%
Jamaicans
0.0
/100
|
#275
Tragic
20.0%
Sub-Saharan Africans
0.0
/100
|
#276
Tragic
20.0%
Immigrants | Barbados
0.0
/100
|
#277
Tragic
20.0%
Immigrants | West Indies
0.0
/100
|
#278
Tragic
20.0%
Bangladeshis
0.0
/100
|
#279
Tragic
20.0%
Central Americans
0.0
/100
|
#280
Tragic
20.1%
Immigrants | Zaire
0.0
/100
|
#281
Tragic
20.1%
Comanche
0.0
/100
|
#282
Tragic
20.1%
Immigrants | Jamaica
0.0
/100
|
#283
Tragic
20.1%
Barbadians
0.0
/100
|
#284
Tragic
20.2%
Arapaho
0.0
/100
|
#285
Tragic
20.2%

Demographics Similar to Koreans by Child Poverty Among Boys Under 16

In terms of child poverty among boys under 16, the demographic groups most similar to Koreans are Lithuanian (14.0%, a difference of 0.030%), Immigrants from Asia (13.9%, a difference of 0.11%), Immigrants from Australia (13.9%, a difference of 0.36%), Immigrants from Northern Europe (13.9%, a difference of 0.49%), and Croatian (14.0%, a difference of 0.50%).
DemographicsRating | RankChild Poverty Among Boys Under 16
Russians
99.7
/100
|
#35
Exceptional
13.8%
Luxembourgers
99.7
/100
|
#36
Exceptional
13.8%
Immigrants | Sri Lanka
99.6
/100
|
#37
Exceptional
13.9%
Immigrants | Northern Europe
99.6
/100
|
#38
Exceptional
13.9%
Immigrants | Australia
99.6
/100
|
#39
Exceptional
13.9%
Immigrants | Asia
99.6
/100
|
#40
Exceptional
13.9%
Lithuanians
99.6
/100
|
#41
Exceptional
14.0%
Koreans
99.6
/100
|
#42
Exceptional
14.0%
Croatians
99.5
/100
|
#43
Exceptional
14.0%
Estonians
99.4
/100
|
#44
Exceptional
14.1%
Immigrants | Scotland
99.4
/100
|
#45
Exceptional
14.1%
Greeks
99.4
/100
|
#46
Exceptional
14.1%
Immigrants | Moldova
99.4
/100
|
#47
Exceptional
14.1%
Immigrants | Indonesia
99.4
/100
|
#48
Exceptional
14.1%
Czechs
99.3
/100
|
#49
Exceptional
14.1%