Immigrants from Belarus vs French Seniors Poverty Over the Age of 75

COMPARE

Immigrants from Belarus
Race
Ancestry
AfghanAfricanAlaska NativeAlaskan AthabascanAlbanianAleutAlsatianAmericanApacheArabArapahoArgentineanArmenianAssyrian/Chaldean/SyriacAustralianAustrianBahamianBangladeshiBarbadianBasqueBelgianBelizeanBermudanBhutaneseBlackfeetBolivianBrazilianBritishBritish West IndianBulgarianBurmeseCajunCambodianCanadianCape VerdeanCarpatho RusynCelticCentral AmericanCentral American IndianCherokeeCheyenneChickasawChileanChineseChippewaChoctawColombianColvilleComancheCosta RicanCreeCreekCroatianCrowCubanCypriotCzechCzechoslovakianDanishDelawareDominicanDutchDutch West IndianEastern EuropeanEcuadorianEgyptianEnglishEstonianEthiopianEuropeanFijianFilipinoFinnishFrench American IndianFrench CanadianGermanGerman RussianGhanaianGreekGuamanian/ChamorroGuatemalanGuyaneseHaitianHmongHonduranHopiHoumaHungarianIcelanderIndian (Asian)IndonesianInupiatIranianIraqiIrishIroquoisIsraeliItalianJamaicanJapaneseJordanianKenyanKiowaKoreanLaotianLatvianLebaneseLiberianLithuanianLumbeeLuxembourgerMacedonianMalaysianMalteseMarshalleseMenomineeMexicanMexican American IndianMongolianMoroccanNative HawaiianNavajoNepaleseNew ZealanderNicaraguanNigerianNorthern EuropeanNorwegianOkinawanOsageOttawaPaiutePakistaniPalestinianPanamanianParaguayanPennsylvania GermanPeruvianPimaPolishPortuguesePotawatomiPuebloPuerto RicanPuget Sound SalishRomanianRussianSalvadoranSamoanScandinavianScotch-IrishScottishSeminoleSenegaleseSerbianShoshoneSierra LeoneanSiouxSlavicSlovakSloveneSomaliSouth AfricanSouth AmericanSouth American IndianSoviet UnionSpaniardSpanishSpanish AmericanSpanish American IndianSri LankanSubsaharan AfricanSudaneseSwedishSwissSyrianTaiwaneseThaiTlingit-HaidaTohono O'OdhamTonganTrinidadian and TobagonianTsimshianTurkishU.S. Virgin IslanderUgandanUkrainianUruguayanUteVenezuelanVietnameseWelshWest IndianYakamaYaquiYugoslavianYumanYup'ikZimbabwean
Immigration
NonimmigrantsImmigrantsAfghanistanAfricaAlbaniaArgentinaArmeniaAsiaAustraliaAustriaBahamasBangladeshBarbadosBelarusBelgiumBelizeBoliviaBosnia and HerzegovinaBrazilBulgariaBurma/MyanmarCabo VerdeCambodiaCameroonCanadaCaribbeanCentral AmericaChileChinaColombiaCongoCosta RicaCroatiaCubaCzechoslovakiaDenmarkDominicaDominican RepublicEastern AfricaEastern AsiaEastern EuropeEcuadorEgyptEl SalvadorEnglandEritreaEthiopiaEuropeFijiFranceGermanyGhanaGreeceGrenadaGuatemalaGuyanaHaitiHondurasHong KongHungaryIndiaIndonesiaIranIraqIrelandIsraelItalyJamaicaJapanJordanKazakhstanKenyaKoreaKuwaitLaosLatin AmericaLatviaLebanonLiberiaLithuaniaMalaysiaMexicoMicronesiaMiddle AfricaMoldovaMoroccoNepalNetherlandsNicaraguaNigeriaNorth AmericaNorth MacedoniaNorthern AfricaNorthern EuropeNorwayOceaniaPakistanPanamaPeruPhilippinesPolandPortugalRomaniaRussiaSaudi ArabiaScotlandSenegalSerbiaSierra LeoneSingaporeSomaliaSouth AfricaSouth AmericaSouth Central AsiaSouth Eastern AsiaSouthern EuropeSpainSri LankaSt. Vincent and the GrenadinesSudanSwedenSwitzerlandSyriaTaiwanThailandTrinidad and TobagoTurkeyUgandaUkraineUruguayUzbekistanVenezuelaVietnamWest IndiesWestern AfricaWestern AsiaWestern EuropeYemenZaireZimbabweAzores
French
Race
Ancestry
AfghanAfricanAlaska NativeAlaskan AthabascanAlbanianAleutAlsatianAmericanApacheArabArapahoArgentineanArmenianAssyrian/Chaldean/SyriacAustralianAustrianBahamianBangladeshiBarbadianBasqueBelgianBelizeanBermudanBhutaneseBlackfeetBolivianBrazilianBritishBritish West IndianBulgarianBurmeseCajunCambodianCanadianCape VerdeanCarpatho RusynCelticCentral AmericanCentral American IndianCherokeeCheyenneChickasawChileanChineseChippewaChoctawColombianColvilleComancheCosta RicanCreeCreekCroatianCrowCubanCypriotCzechCzechoslovakianDanishDelawareDominicanDutchDutch West IndianEastern EuropeanEcuadorianEgyptianEnglishEstonianEthiopianEuropeanFijianFilipinoFinnishFrenchFrench American IndianFrench CanadianGermanGerman RussianGhanaianGreekGuamanian/ChamorroGuatemalanGuyaneseHaitianHmongHonduranHopiHoumaHungarianIcelanderIndian (Asian)IndonesianInupiatIranianIraqiIrishIroquoisIsraeliItalianJamaicanJapaneseJordanianKenyanKiowaKoreanLaotianLatvianLebaneseLiberianLithuanianLumbeeLuxembourgerMacedonianMalaysianMalteseMarshalleseMenomineeMexicanMexican American IndianMongolianMoroccanNative HawaiianNavajoNepaleseNew ZealanderNicaraguanNigerianNorthern EuropeanNorwegianOkinawanOsageOttawaPaiutePakistaniPalestinianPanamanianParaguayanPennsylvania GermanPeruvianPimaPolishPortuguesePotawatomiPuebloPuerto RicanPuget Sound SalishRomanianRussianSalvadoranSamoanScandinavianScotch-IrishScottishSeminoleSenegaleseSerbianShoshoneSierra LeoneanSiouxSlavicSlovakSloveneSomaliSouth AfricanSouth AmericanSouth American IndianSoviet UnionSpaniardSpanishSpanish AmericanSpanish American IndianSri LankanSubsaharan AfricanSudaneseSwedishSwissSyrianTaiwaneseThaiTlingit-HaidaTohono O'OdhamTonganTrinidadian and TobagonianTsimshianTurkishU.S. Virgin IslanderUgandanUkrainianUruguayanUteVenezuelanVietnameseWelshWest IndianYakamaYaquiYugoslavianYumanYup'ikZimbabwean
Immigration
NonimmigrantsImmigrantsAfghanistanAfricaAlbaniaArgentinaArmeniaAsiaAustraliaAustriaBahamasBangladeshBarbadosBelgiumBelizeBoliviaBosnia and HerzegovinaBrazilBulgariaBurma/MyanmarCabo VerdeCambodiaCameroonCanadaCaribbeanCentral AmericaChileChinaColombiaCongoCosta RicaCroatiaCubaCzechoslovakiaDenmarkDominicaDominican RepublicEastern AfricaEastern AsiaEastern EuropeEcuadorEgyptEl SalvadorEnglandEritreaEthiopiaEuropeFijiFranceGermanyGhanaGreeceGrenadaGuatemalaGuyanaHaitiHondurasHong KongHungaryIndiaIndonesiaIranIraqIrelandIsraelItalyJamaicaJapanJordanKazakhstanKenyaKoreaKuwaitLaosLatin AmericaLatviaLebanonLiberiaLithuaniaMalaysiaMexicoMicronesiaMiddle AfricaMoldovaMoroccoNepalNetherlandsNicaraguaNigeriaNorth AmericaNorth MacedoniaNorthern AfricaNorthern EuropeNorwayOceaniaPakistanPanamaPeruPhilippinesPolandPortugalRomaniaRussiaSaudi ArabiaScotlandSenegalSerbiaSierra LeoneSingaporeSomaliaSouth AfricaSouth AmericaSouth Central AsiaSouth Eastern AsiaSouthern EuropeSpainSri LankaSt. Vincent and the GrenadinesSudanSwedenSwitzerlandSyriaTaiwanThailandTrinidad and TobagoTurkeyUgandaUkraineUruguayUzbekistanVenezuelaVietnamWest IndiesWestern AfricaWestern AsiaWestern EuropeYemenZaireZimbabweAzores
Seniors Poverty Over the Age of 75
Income
Poverty
Unemployment
Labor Participation
Family Structure
Vehicle Availability
Education Level
Disability

Seniors Poverty Over the Age of 75 Comparison

Immigrants from Belarus

French

Tragic
Exceptional
13.8%
SENIORS POVERTY OVER THE AGE OF 75
0.2/ 100
METRIC RATING
255th/ 347
METRIC RANK
11.1%
SENIORS POVERTY OVER THE AGE OF 75
98.7/ 100
METRIC RATING
48th/ 347
METRIC RANK

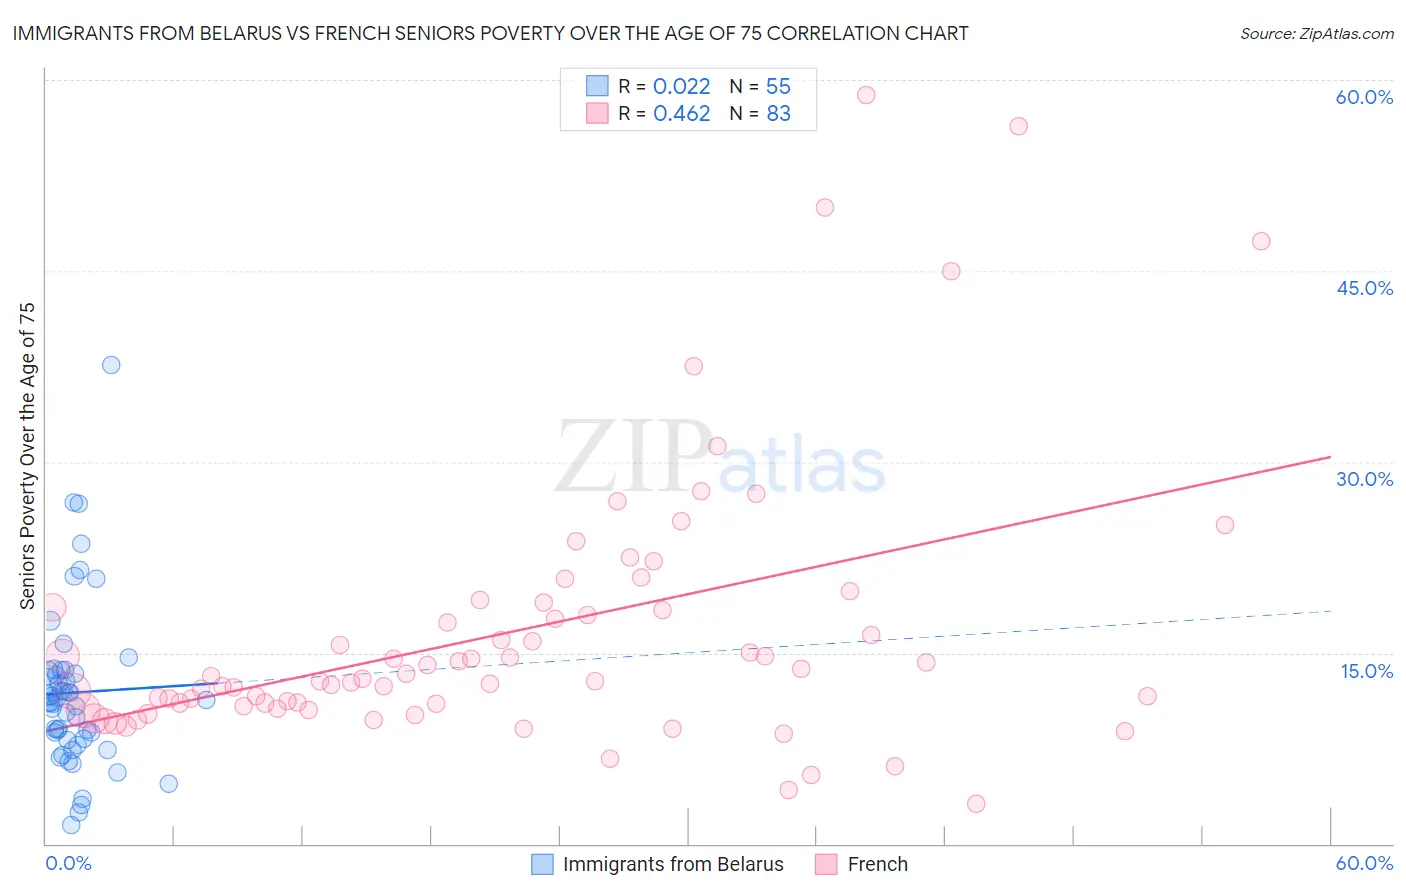
Immigrants from Belarus vs French Seniors Poverty Over the Age of 75 Correlation Chart

The statistical analysis conducted on geographies consisting of 149,396,429 people shows no correlation between the proportion of Immigrants from Belarus and poverty level among seniors over the age of 75 in the United States with a correlation coefficient (R) of 0.022 and weighted average of 13.8%. Similarly, the statistical analysis conducted on geographies consisting of 555,221,487 people shows a moderate positive correlation between the proportion of French and poverty level among seniors over the age of 75 in the United States with a correlation coefficient (R) of 0.462 and weighted average of 11.1%, a difference of 23.9%.
Immigrants from Belarus vs French Seniors Poverty Over the Age of 75

Seniors Poverty Over the Age of 75 Correlation Summary

MeasurementImmigrants from BelarusFrench
Minimum1.5%3.1%
Maximum37.7%58.9%
Range36.2%55.7%
Mean11.9%16.7%
Median11.1%13.0%
Interquartile 25% (IQ1)8.1%10.8%
Interquartile 75% (IQ3)13.4%18.6%
Interquartile Range (IQR)5.3%7.8%
Standard Deviation (Sample)6.5%10.8%
Standard Deviation (Population)6.4%10.7%

Similar Demographics by Seniors Poverty Over the Age of 75

Demographics Similar to Immigrants from Belarus by Seniors Poverty Over the Age of 75

In terms of seniors poverty over the age of 75, the demographic groups most similar to Immigrants from Belarus are Blackfeet (13.7%, a difference of 0.43%), Inupiat (13.8%, a difference of 0.50%), Immigrants from Spain (13.7%, a difference of 0.54%), Immigrants from Argentina (13.7%, a difference of 0.76%), and Immigrants from Peru (13.7%, a difference of 0.81%).
DemographicsRating | RankSeniors Poverty Over the Age of 75
Africans
0.3
/100
|
#248
Tragic
13.6%
Immigrants | Albania
0.3
/100
|
#249
Tragic
13.6%
Mexican American Indians
0.3
/100
|
#250
Tragic
13.6%
Immigrants | Peru
0.3
/100
|
#251
Tragic
13.7%
Immigrants | Argentina
0.3
/100
|
#252
Tragic
13.7%
Immigrants | Spain
0.2
/100
|
#253
Tragic
13.7%
Blackfeet
0.2
/100
|
#254
Tragic
13.7%
Immigrants | Belarus
0.2
/100
|
#255
Tragic
13.8%
Inupiat
0.1
/100
|
#256
Tragic
13.8%
Immigrants | Western Africa
0.1
/100
|
#257
Tragic
13.9%
Immigrants | Panama
0.1
/100
|
#258
Tragic
13.9%
Immigrants | Portugal
0.1
/100
|
#259
Tragic
13.9%
Immigrants | Immigrants
0.1
/100
|
#260
Tragic
13.9%
Ghanaians
0.1
/100
|
#261
Tragic
14.0%
Cajuns
0.1
/100
|
#262
Tragic
14.0%

Demographics Similar to French by Seniors Poverty Over the Age of 75

In terms of seniors poverty over the age of 75, the demographic groups most similar to French are Hawaiian (11.1%, a difference of 0.040%), Samoan (11.1%, a difference of 0.11%), Serbian (11.1%, a difference of 0.22%), Immigrants from North Macedonia (11.1%, a difference of 0.25%), and Zimbabwean (11.2%, a difference of 0.40%).
DemographicsRating | RankSeniors Poverty Over the Age of 75
Immigrants | Lithuania
99.2
/100
|
#41
Exceptional
11.0%
Austrians
99.1
/100
|
#42
Exceptional
11.0%
Celtics
99.1
/100
|
#43
Exceptional
11.0%
Belgians
99.1
/100
|
#44
Exceptional
11.0%
Carpatho Rusyns
99.0
/100
|
#45
Exceptional
11.1%
Greeks
99.0
/100
|
#46
Exceptional
11.1%
Hawaiians
98.8
/100
|
#47
Exceptional
11.1%
French
98.7
/100
|
#48
Exceptional
11.1%
Samoans
98.7
/100
|
#49
Exceptional
11.1%
Serbians
98.6
/100
|
#50
Exceptional
11.1%
Immigrants | North Macedonia
98.6
/100
|
#51
Exceptional
11.1%
Zimbabweans
98.5
/100
|
#52
Exceptional
11.2%
Immigrants | England
98.4
/100
|
#53
Exceptional
11.2%
Afghans
98.2
/100
|
#54
Exceptional
11.2%
Hungarians
98.1
/100
|
#55
Exceptional
11.2%