Immigrants from Belarus vs French High School Diploma
COMPARE
Immigrants from Belarus
French
High School Diploma
High School Diploma Comparison
Immigrants from Belarus
French
90.2%
HIGH SCHOOL DIPLOMA
96.4/ 100
METRIC RATING
112th/ 347
METRIC RANK
91.0%
HIGH SCHOOL DIPLOMA
99.5/ 100
METRIC RATING
66th/ 347
METRIC RANK
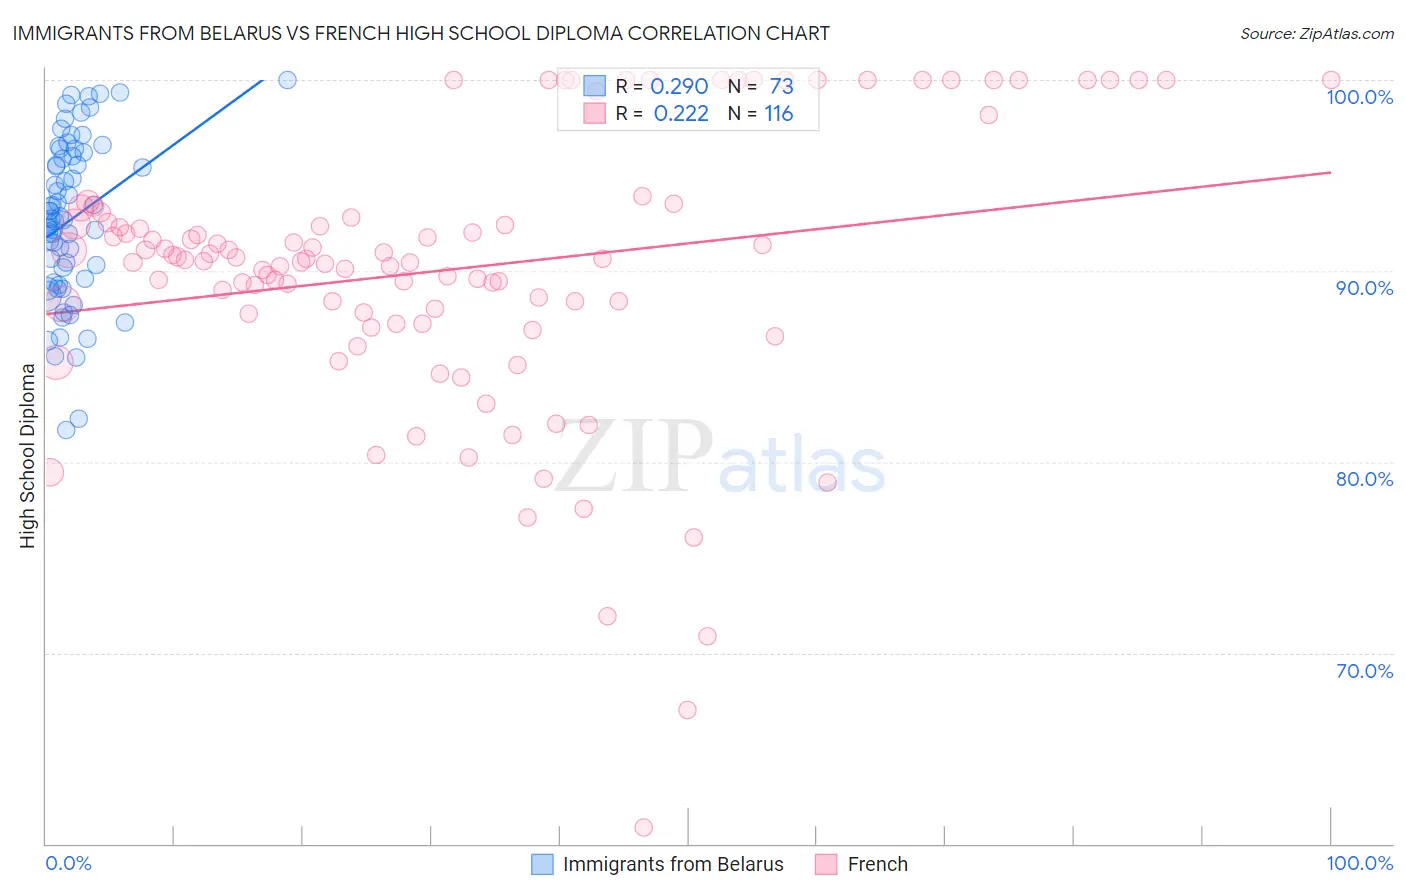
Immigrants from Belarus vs French High School Diploma Correlation Chart
The statistical analysis conducted on geographies consisting of 150,125,045 people shows a weak positive correlation between the proportion of Immigrants from Belarus and percentage of population with at least high school diploma education in the United States with a correlation coefficient (R) of 0.290 and weighted average of 90.2%. Similarly, the statistical analysis conducted on geographies consisting of 572,427,361 people shows a weak positive correlation between the proportion of French and percentage of population with at least high school diploma education in the United States with a correlation coefficient (R) of 0.222 and weighted average of 91.0%, a difference of 0.78%.
High School Diploma Correlation Summary
| Measurement | Immigrants from Belarus | French |
| Minimum | 81.7% | 60.9% |
| Maximum | 100.0% | 100.0% |
| Range | 18.3% | 39.1% |
| Mean | 92.7% | 90.1% |
| Median | 92.7% | 90.6% |
| Interquartile 25% (IQ1) | 89.5% | 87.8% |
| Interquartile 75% (IQ3) | 96.1% | 92.9% |
| Interquartile Range (IQR) | 6.6% | 5.1% |
| Standard Deviation (Sample) | 4.2% | 7.3% |
| Standard Deviation (Population) | 4.2% | 7.2% |
Similar Demographics by High School Diploma
Demographics Similar to Immigrants from Belarus by High School Diploma
In terms of high school diploma, the demographic groups most similar to Immigrants from Belarus are Immigrants from Sri Lanka (90.2%, a difference of 0.010%), Yugoslavian (90.2%, a difference of 0.020%), Immigrants from Greece (90.3%, a difference of 0.030%), Menominee (90.3%, a difference of 0.030%), and Palestinian (90.3%, a difference of 0.040%).
| Demographics | Rating | Rank | High School Diploma |
| Lebanese | 97.4 /100 | #105 | Exceptional 90.4% |
| Syrians | 97.0 /100 | #106 | Exceptional 90.3% |
| Immigrants | Russia | 96.9 /100 | #107 | Exceptional 90.3% |
| Palestinians | 96.7 /100 | #108 | Exceptional 90.3% |
| Immigrants | Zimbabwe | 96.7 /100 | #109 | Exceptional 90.3% |
| Immigrants | Greece | 96.6 /100 | #110 | Exceptional 90.3% |
| Menominee | 96.6 /100 | #111 | Exceptional 90.3% |
| Immigrants | Belarus | 96.4 /100 | #112 | Exceptional 90.2% |
| Immigrants | Sri Lanka | 96.3 /100 | #113 | Exceptional 90.2% |
| Yugoslavians | 96.2 /100 | #114 | Exceptional 90.2% |
| Immigrants | Hungary | 95.8 /100 | #115 | Exceptional 90.2% |
| Immigrants | Germany | 95.7 /100 | #116 | Exceptional 90.2% |
| Jordanians | 95.4 /100 | #117 | Exceptional 90.2% |
| Israelis | 95.1 /100 | #118 | Exceptional 90.1% |
| Immigrants | Eastern Europe | 94.9 /100 | #119 | Exceptional 90.1% |
Demographics Similar to French by High School Diploma
In terms of high school diploma, the demographic groups most similar to French are Ukrainian (91.0%, a difference of 0.010%), Immigrants from South Africa (91.0%, a difference of 0.010%), Immigrants from Netherlands (91.0%, a difference of 0.020%), Immigrants from Iran (90.9%, a difference of 0.020%), and Czechoslovakian (90.9%, a difference of 0.030%).
| Demographics | Rating | Rank | High School Diploma |
| Immigrants | North America | 99.7 /100 | #59 | Exceptional 91.0% |
| Immigrants | Japan | 99.6 /100 | #60 | Exceptional 91.0% |
| Immigrants | Taiwan | 99.6 /100 | #61 | Exceptional 91.0% |
| Austrians | 99.6 /100 | #62 | Exceptional 91.0% |
| Immigrants | Netherlands | 99.6 /100 | #63 | Exceptional 91.0% |
| Ukrainians | 99.6 /100 | #64 | Exceptional 91.0% |
| Immigrants | South Africa | 99.6 /100 | #65 | Exceptional 91.0% |
| French | 99.5 /100 | #66 | Exceptional 91.0% |
| Immigrants | Iran | 99.5 /100 | #67 | Exceptional 90.9% |
| Czechoslovakians | 99.5 /100 | #68 | Exceptional 90.9% |
| French Canadians | 99.5 /100 | #69 | Exceptional 90.9% |
| Immigrants | Latvia | 99.5 /100 | #70 | Exceptional 90.9% |
| Alaskan Athabascans | 99.4 /100 | #71 | Exceptional 90.9% |
| Soviet Union | 99.4 /100 | #72 | Exceptional 90.9% |
| Immigrants | South Central Asia | 99.4 /100 | #73 | Exceptional 90.9% |