Immigrants from Bahamas vs Celtic Receiving Food Stamps
COMPARE
Immigrants from Bahamas
Celtic
Receiving Food Stamps
Receiving Food Stamps Comparison
Immigrants from Bahamas
Celtics
15.8%
RECEIVING FOOD STAMPS
0.0/ 100
METRIC RATING
297th/ 347
METRIC RANK
10.9%
RECEIVING FOOD STAMPS
87.8/ 100
METRIC RATING
140th/ 347
METRIC RANK
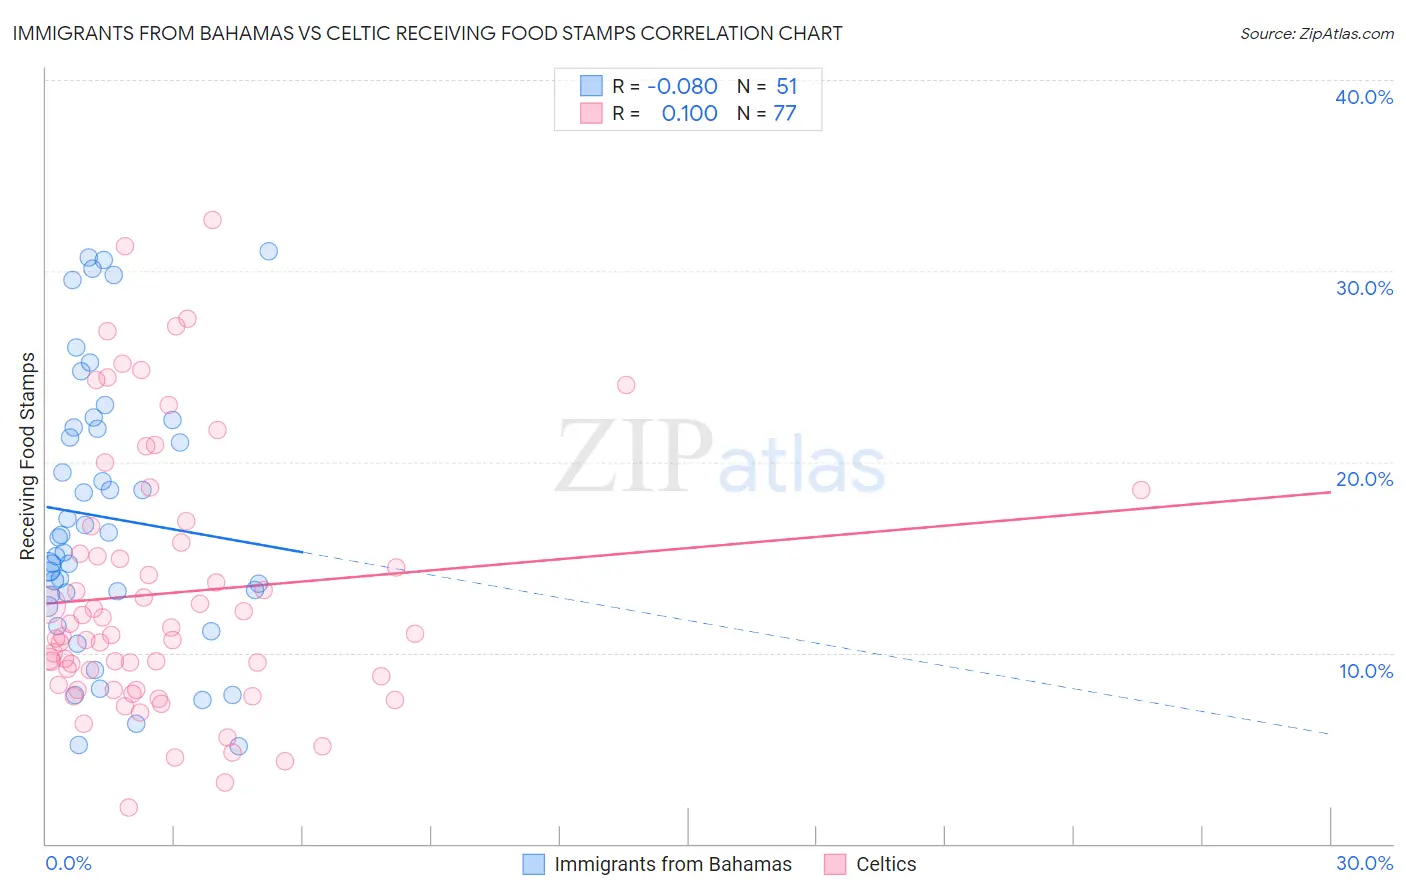
Immigrants from Bahamas vs Celtic Receiving Food Stamps Correlation Chart
The statistical analysis conducted on geographies consisting of 104,572,016 people shows a slight negative correlation between the proportion of Immigrants from Bahamas and percentage of population receiving government assistance and/or food stamps in the United States with a correlation coefficient (R) of -0.080 and weighted average of 15.8%. Similarly, the statistical analysis conducted on geographies consisting of 168,687,125 people shows a slight positive correlation between the proportion of Celtics and percentage of population receiving government assistance and/or food stamps in the United States with a correlation coefficient (R) of 0.100 and weighted average of 10.9%, a difference of 44.2%.
Receiving Food Stamps Correlation Summary
| Measurement | Immigrants from Bahamas | Celtic |
| Minimum | 5.1% | 1.9% |
| Maximum | 31.0% | 32.7% |
| Range | 25.9% | 30.8% |
| Mean | 17.1% | 13.1% |
| Median | 16.0% | 11.0% |
| Interquartile 25% (IQ1) | 13.1% | 8.2% |
| Interquartile 75% (IQ3) | 21.8% | 16.2% |
| Interquartile Range (IQR) | 8.7% | 8.0% |
| Standard Deviation (Sample) | 7.1% | 6.9% |
| Standard Deviation (Population) | 7.0% | 6.8% |
Similar Demographics by Receiving Food Stamps
Demographics Similar to Immigrants from Bahamas by Receiving Food Stamps
In terms of receiving food stamps, the demographic groups most similar to Immigrants from Bahamas are Tsimshian (15.7%, a difference of 0.16%), Immigrants from Honduras (15.7%, a difference of 0.17%), Immigrants from Trinidad and Tobago (15.8%, a difference of 0.25%), Immigrants from Latin America (15.7%, a difference of 0.49%), and Hispanic or Latino (15.8%, a difference of 0.53%).
| Demographics | Rating | Rank | Receiving Food Stamps |
| Senegalese | 0.0 /100 | #290 | Tragic 15.4% |
| Hondurans | 0.0 /100 | #291 | Tragic 15.5% |
| Alaska Natives | 0.0 /100 | #292 | Tragic 15.6% |
| Vietnamese | 0.0 /100 | #293 | Tragic 15.7% |
| Immigrants | Latin America | 0.0 /100 | #294 | Tragic 15.7% |
| Immigrants | Honduras | 0.0 /100 | #295 | Tragic 15.7% |
| Tsimshian | 0.0 /100 | #296 | Tragic 15.7% |
| Immigrants | Bahamas | 0.0 /100 | #297 | Tragic 15.8% |
| Immigrants | Trinidad and Tobago | 0.0 /100 | #298 | Tragic 15.8% |
| Hispanics or Latinos | 0.0 /100 | #299 | Tragic 15.8% |
| Immigrants | Bangladesh | 0.0 /100 | #300 | Tragic 15.9% |
| Trinidadians and Tobagonians | 0.0 /100 | #301 | Tragic 16.0% |
| Immigrants | West Indies | 0.0 /100 | #302 | Tragic 16.1% |
| Nicaraguans | 0.0 /100 | #303 | Tragic 16.1% |
| West Indians | 0.0 /100 | #304 | Tragic 16.3% |
Demographics Similar to Celtics by Receiving Food Stamps
In terms of receiving food stamps, the demographic groups most similar to Celtics are Hmong (10.9%, a difference of 0.20%), Immigrants from Moldova (10.9%, a difference of 0.24%), Immigrants from Vietnam (11.0%, a difference of 0.36%), Chilean (11.0%, a difference of 0.53%), and Immigrants from Northern Africa (11.0%, a difference of 0.61%).
| Demographics | Rating | Rank | Receiving Food Stamps |
| Immigrants | Russia | 90.9 /100 | #133 | Exceptional 10.8% |
| Immigrants | Brazil | 90.3 /100 | #134 | Exceptional 10.8% |
| Argentineans | 90.2 /100 | #135 | Exceptional 10.8% |
| Slovaks | 89.8 /100 | #136 | Excellent 10.8% |
| Immigrants | Eastern Europe | 89.8 /100 | #137 | Excellent 10.8% |
| Immigrants | Moldova | 88.5 /100 | #138 | Excellent 10.9% |
| Hmong | 88.4 /100 | #139 | Excellent 10.9% |
| Celtics | 87.8 /100 | #140 | Excellent 10.9% |
| Immigrants | Vietnam | 86.7 /100 | #141 | Excellent 11.0% |
| Chileans | 86.2 /100 | #142 | Excellent 11.0% |
| Immigrants | Northern Africa | 86.0 /100 | #143 | Excellent 11.0% |
| Syrians | 85.5 /100 | #144 | Excellent 11.0% |
| Hungarians | 85.1 /100 | #145 | Excellent 11.0% |
| Taiwanese | 84.2 /100 | #146 | Excellent 11.0% |
| Whites/Caucasians | 83.9 /100 | #147 | Excellent 11.1% |