Immigrants from Asia vs Immigrants from Eastern Asia Receiving Food Stamps

COMPARE

Immigrants from Asia
Race
Ancestry
AfghanAfricanAlaska NativeAlaskan AthabascanAlbanianAleutAlsatianAmericanApacheArabArapahoArgentineanArmenianAssyrian/Chaldean/SyriacAustralianAustrianBahamianBangladeshiBarbadianBasqueBelgianBelizeanBermudanBhutaneseBlackfeetBolivianBrazilianBritishBritish West IndianBulgarianBurmeseCajunCambodianCanadianCape VerdeanCarpatho RusynCelticCentral AmericanCentral American IndianCherokeeCheyenneChickasawChileanChineseChippewaChoctawColombianColvilleComancheCosta RicanCreeCreekCroatianCrowCubanCypriotCzechCzechoslovakianDanishDelawareDominicanDutchDutch West IndianEastern EuropeanEcuadorianEgyptianEnglishEstonianEthiopianEuropeanFijianFilipinoFinnishFrenchFrench American IndianFrench CanadianGermanGerman RussianGhanaianGreekGuamanian/ChamorroGuatemalanGuyaneseHaitianHmongHonduranHopiHoumaHungarianIcelanderIndian (Asian)IndonesianInupiatIranianIraqiIrishIroquoisIsraeliItalianJamaicanJapaneseJordanianKenyanKiowaKoreanLaotianLatvianLebaneseLiberianLithuanianLumbeeLuxembourgerMacedonianMalaysianMalteseMarshalleseMenomineeMexicanMexican American IndianMongolianMoroccanNative HawaiianNavajoNepaleseNew ZealanderNicaraguanNigerianNorthern EuropeanNorwegianOkinawanOsageOttawaPaiutePakistaniPalestinianPanamanianParaguayanPennsylvania GermanPeruvianPimaPolishPortuguesePotawatomiPuebloPuerto RicanPuget Sound SalishRomanianRussianSalvadoranSamoanScandinavianScotch-IrishScottishSeminoleSenegaleseSerbianShoshoneSierra LeoneanSiouxSlavicSlovakSloveneSomaliSouth AfricanSouth AmericanSouth American IndianSoviet UnionSpaniardSpanishSpanish AmericanSpanish American IndianSri LankanSubsaharan AfricanSudaneseSwedishSwissSyrianTaiwaneseThaiTlingit-HaidaTohono O'OdhamTonganTrinidadian and TobagonianTsimshianTurkishU.S. Virgin IslanderUgandanUkrainianUruguayanUteVenezuelanVietnameseWelshWest IndianYakamaYaquiYugoslavianYumanYup'ikZimbabwean
Immigration
NonimmigrantsImmigrantsAfghanistanAfricaAlbaniaArgentinaArmeniaAsiaAustraliaAustriaBahamasBangladeshBarbadosBelarusBelgiumBelizeBoliviaBosnia and HerzegovinaBrazilBulgariaBurma/MyanmarCabo VerdeCambodiaCameroonCanadaCaribbeanCentral AmericaChileChinaColombiaCongoCosta RicaCroatiaCubaCzechoslovakiaDenmarkDominicaDominican RepublicEastern AfricaEastern EuropeEcuadorEgyptEl SalvadorEnglandEritreaEthiopiaEuropeFijiFranceGermanyGhanaGreeceGrenadaGuatemalaGuyanaHaitiHondurasHong KongHungaryIndiaIndonesiaIranIraqIrelandIsraelItalyJamaicaJapanJordanKazakhstanKenyaKoreaKuwaitLaosLatin AmericaLatviaLebanonLiberiaLithuaniaMalaysiaMexicoMicronesiaMiddle AfricaMoldovaMoroccoNepalNetherlandsNicaraguaNigeriaNorth AmericaNorth MacedoniaNorthern AfricaNorthern EuropeNorwayOceaniaPakistanPanamaPeruPhilippinesPolandPortugalRomaniaRussiaSaudi ArabiaScotlandSenegalSerbiaSierra LeoneSingaporeSomaliaSouth AfricaSouth AmericaSouth Central AsiaSouth Eastern AsiaSouthern EuropeSpainSri LankaSt. Vincent and the GrenadinesSudanSwedenSwitzerlandSyriaTaiwanThailandTrinidad and TobagoTurkeyUgandaUkraineUruguayUzbekistanVenezuelaVietnamWest IndiesWestern AfricaWestern AsiaWestern EuropeYemenZaireZimbabweAzores
Immigrants from Eastern Asia
Race
Ancestry
AfghanAfricanAlaska NativeAlaskan AthabascanAlbanianAleutAlsatianAmericanApacheArabArapahoArgentineanArmenianAssyrian/Chaldean/SyriacAustralianAustrianBahamianBangladeshiBarbadianBasqueBelgianBelizeanBermudanBhutaneseBlackfeetBolivianBrazilianBritishBritish West IndianBulgarianBurmeseCajunCambodianCanadianCape VerdeanCarpatho RusynCelticCentral AmericanCentral American IndianCherokeeCheyenneChickasawChileanChineseChippewaChoctawColombianColvilleComancheCosta RicanCreeCreekCroatianCrowCubanCypriotCzechCzechoslovakianDanishDelawareDominicanDutchDutch West IndianEastern EuropeanEcuadorianEgyptianEnglishEstonianEthiopianEuropeanFijianFilipinoFinnishFrenchFrench American IndianFrench CanadianGermanGerman RussianGhanaianGreekGuamanian/ChamorroGuatemalanGuyaneseHaitianHmongHonduranHopiHoumaHungarianIcelanderIndian (Asian)IndonesianInupiatIranianIraqiIrishIroquoisIsraeliItalianJamaicanJapaneseJordanianKenyanKiowaKoreanLaotianLatvianLebaneseLiberianLithuanianLumbeeLuxembourgerMacedonianMalaysianMalteseMarshalleseMenomineeMexicanMexican American IndianMongolianMoroccanNative HawaiianNavajoNepaleseNew ZealanderNicaraguanNigerianNorthern EuropeanNorwegianOkinawanOsageOttawaPaiutePakistaniPalestinianPanamanianParaguayanPennsylvania GermanPeruvianPimaPolishPortuguesePotawatomiPuebloPuerto RicanPuget Sound SalishRomanianRussianSalvadoranSamoanScandinavianScotch-IrishScottishSeminoleSenegaleseSerbianShoshoneSierra LeoneanSiouxSlavicSlovakSloveneSomaliSouth AfricanSouth AmericanSouth American IndianSoviet UnionSpaniardSpanishSpanish AmericanSpanish American IndianSri LankanSubsaharan AfricanSudaneseSwedishSwissSyrianTaiwaneseThaiTlingit-HaidaTohono O'OdhamTonganTrinidadian and TobagonianTsimshianTurkishU.S. Virgin IslanderUgandanUkrainianUruguayanUteVenezuelanVietnameseWelshWest IndianYakamaYaquiYugoslavianYumanYup'ikZimbabwean
Immigration
NonimmigrantsImmigrantsAfghanistanAfricaAlbaniaArgentinaArmeniaAustraliaAustriaBahamasBangladeshBarbadosBelarusBelgiumBelizeBoliviaBosnia and HerzegovinaBrazilBulgariaBurma/MyanmarCabo VerdeCambodiaCameroonCanadaCaribbeanCentral AmericaChileChinaColombiaCongoCosta RicaCroatiaCubaCzechoslovakiaDenmarkDominicaDominican RepublicEastern AfricaEastern AsiaEastern EuropeEcuadorEgyptEl SalvadorEnglandEritreaEthiopiaEuropeFijiFranceGermanyGhanaGreeceGrenadaGuatemalaGuyanaHaitiHondurasHong KongHungaryIndiaIndonesiaIranIraqIrelandIsraelItalyJamaicaJapanJordanKazakhstanKenyaKoreaKuwaitLaosLatin AmericaLatviaLebanonLiberiaLithuaniaMalaysiaMexicoMicronesiaMiddle AfricaMoldovaMoroccoNepalNetherlandsNicaraguaNigeriaNorth AmericaNorth MacedoniaNorthern AfricaNorthern EuropeNorwayOceaniaPakistanPanamaPeruPhilippinesPolandPortugalRomaniaRussiaSaudi ArabiaScotlandSenegalSerbiaSierra LeoneSingaporeSomaliaSouth AfricaSouth AmericaSouth Central AsiaSouth Eastern AsiaSouthern EuropeSpainSri LankaSt. Vincent and the GrenadinesSudanSwedenSwitzerlandSyriaTaiwanThailandTrinidad and TobagoTurkeyUgandaUkraineUruguayUzbekistanVenezuelaVietnamWest IndiesWestern AfricaWestern AsiaWestern EuropeYemenZaireZimbabweAzores
Receiving Food Stamps
Income
Poverty
Unemployment
Labor Participation
Family Structure
Vehicle Availability
Education Level
Disability

Receiving Food Stamps Comparison

Immigrants from Asia

Immigrants from Eastern Asia

Exceptional
Exceptional
9.9%
RECEIVING FOOD STAMPS
98.9/ 100
METRIC RATING
72nd/ 347
METRIC RANK
9.3%
RECEIVING FOOD STAMPS
99.7/ 100
METRIC RATING
31st/ 347
METRIC RANK

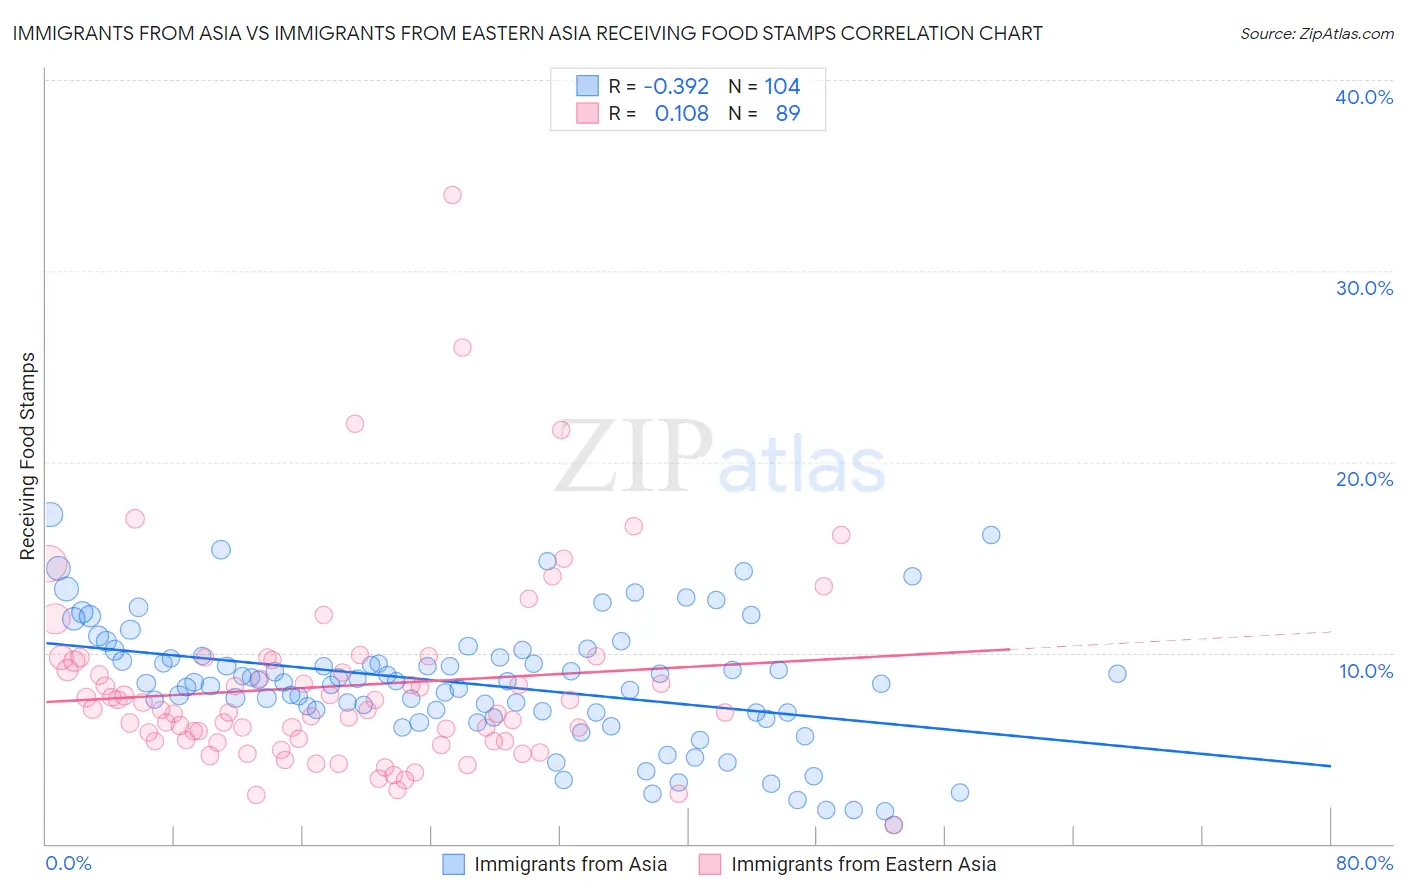
Immigrants from Asia vs Immigrants from Eastern Asia Receiving Food Stamps Correlation Chart

The statistical analysis conducted on geographies consisting of 546,090,364 people shows a mild negative correlation between the proportion of Immigrants from Asia and percentage of population receiving government assistance and/or food stamps in the United States with a correlation coefficient (R) of -0.392 and weighted average of 9.9%. Similarly, the statistical analysis conducted on geographies consisting of 497,431,839 people shows a poor positive correlation between the proportion of Immigrants from Eastern Asia and percentage of population receiving government assistance and/or food stamps in the United States with a correlation coefficient (R) of 0.108 and weighted average of 9.3%, a difference of 6.2%.
Immigrants from Asia vs Immigrants from Eastern Asia Receiving Food Stamps

Receiving Food Stamps Correlation Summary

MeasurementImmigrants from AsiaImmigrants from Eastern Asia
Minimum1.0%1.0%
Maximum17.2%34.0%
Range16.2%33.0%
Mean8.4%8.3%
Median8.4%7.0%
Interquartile 25% (IQ1)6.9%5.4%
Interquartile 75% (IQ3)9.8%9.6%
Interquartile Range (IQR)2.9%4.2%
Standard Deviation (Sample)3.3%5.1%
Standard Deviation (Population)3.3%5.1%

Similar Demographics by Receiving Food Stamps

Demographics Similar to Immigrants from Asia by Receiving Food Stamps

In terms of receiving food stamps, the demographic groups most similar to Immigrants from Asia are Macedonian (9.9%, a difference of 0.060%), New Zealander (9.9%, a difference of 0.23%), Scottish (9.9%, a difference of 0.24%), Immigrants from Serbia (9.9%, a difference of 0.37%), and Italian (9.9%, a difference of 0.42%).
DemographicsRating | RankReceiving Food Stamps
Immigrants | Turkey
99.1
/100
|
#65
Exceptional
9.8%
Slovenes
99.1
/100
|
#66
Exceptional
9.8%
Immigrants | Indonesia
99.0
/100
|
#67
Exceptional
9.8%
Northern Europeans
99.0
/100
|
#68
Exceptional
9.8%
Italians
99.0
/100
|
#69
Exceptional
9.9%
Immigrants | Serbia
99.0
/100
|
#70
Exceptional
9.9%
Scottish
98.9
/100
|
#71
Exceptional
9.9%
Immigrants | Asia
98.9
/100
|
#72
Exceptional
9.9%
Macedonians
98.9
/100
|
#73
Exceptional
9.9%
New Zealanders
98.8
/100
|
#74
Exceptional
9.9%
Immigrants | Zimbabwe
98.7
/100
|
#75
Exceptional
9.9%
Immigrants | Croatia
98.7
/100
|
#76
Exceptional
10.0%
Immigrants | North Macedonia
98.7
/100
|
#77
Exceptional
10.0%
South Africans
98.7
/100
|
#78
Exceptional
10.0%
Laotians
98.7
/100
|
#79
Exceptional
10.0%

Demographics Similar to Immigrants from Eastern Asia by Receiving Food Stamps

In terms of receiving food stamps, the demographic groups most similar to Immigrants from Eastern Asia are Bolivian (9.3%, a difference of 0.31%), Immigrants from Sweden (9.3%, a difference of 0.41%), Immigrants from Lithuania (9.2%, a difference of 0.78%), Czech (9.2%, a difference of 1.1%), and Bhutanese (9.2%, a difference of 1.1%).
DemographicsRating | RankReceiving Food Stamps
Immigrants | Northern Europe
99.8
/100
|
#24
Exceptional
9.2%
Immigrants | Ireland
99.8
/100
|
#25
Exceptional
9.2%
Swedes
99.8
/100
|
#26
Exceptional
9.2%
Bhutanese
99.8
/100
|
#27
Exceptional
9.2%
Czechs
99.8
/100
|
#28
Exceptional
9.2%
Immigrants | Lithuania
99.8
/100
|
#29
Exceptional
9.2%
Immigrants | Sweden
99.7
/100
|
#30
Exceptional
9.3%
Immigrants | Eastern Asia
99.7
/100
|
#31
Exceptional
9.3%
Bolivians
99.7
/100
|
#32
Exceptional
9.3%
Zimbabweans
99.6
/100
|
#33
Exceptional
9.5%
Turks
99.6
/100
|
#34
Exceptional
9.5%
Immigrants | Austria
99.6
/100
|
#35
Exceptional
9.5%
Estonians
99.6
/100
|
#36
Exceptional
9.5%
Europeans
99.6
/100
|
#37
Exceptional
9.5%
Immigrants | Sri Lanka
99.5
/100
|
#38
Exceptional
9.5%