Haitian vs Carpatho Rusyn Receiving Food Stamps
COMPARE
Haitian
Carpatho Rusyn
Receiving Food Stamps
Receiving Food Stamps Comparison
Haitians
Carpatho Rusyns
17.8%
RECEIVING FOOD STAMPS
0.0/ 100
METRIC RATING
323rd/ 347
METRIC RANK
10.4%
RECEIVING FOOD STAMPS
96.2/ 100
METRIC RATING
108th/ 347
METRIC RANK
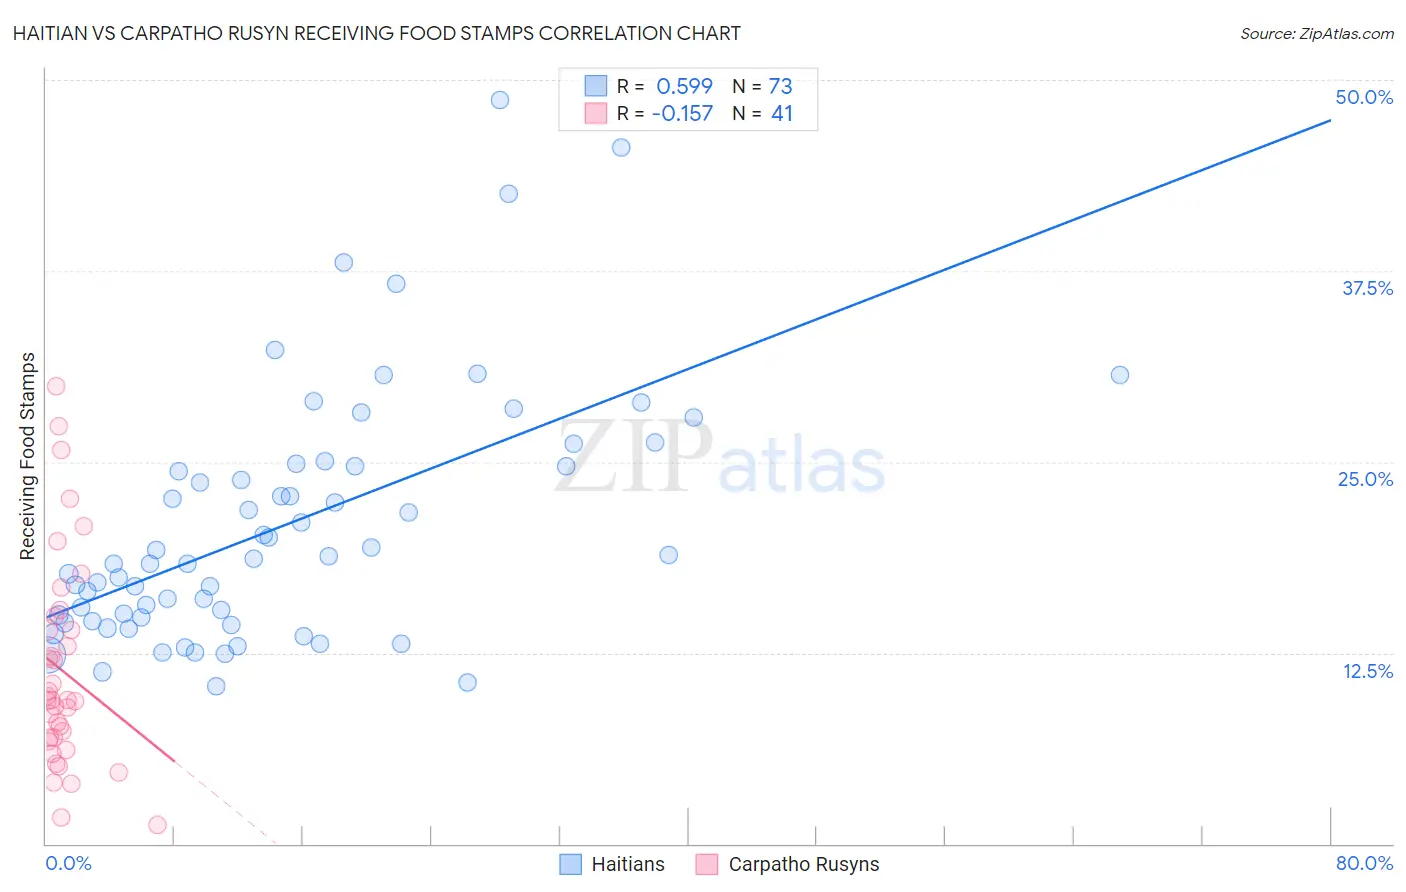
Haitian vs Carpatho Rusyn Receiving Food Stamps Correlation Chart
The statistical analysis conducted on geographies consisting of 287,415,058 people shows a substantial positive correlation between the proportion of Haitians and percentage of population receiving government assistance and/or food stamps in the United States with a correlation coefficient (R) of 0.599 and weighted average of 17.8%. Similarly, the statistical analysis conducted on geographies consisting of 58,758,722 people shows a poor negative correlation between the proportion of Carpatho Rusyns and percentage of population receiving government assistance and/or food stamps in the United States with a correlation coefficient (R) of -0.157 and weighted average of 10.4%, a difference of 70.9%.
Receiving Food Stamps Correlation Summary
| Measurement | Haitian | Carpatho Rusyn |
| Minimum | 10.3% | 1.2% |
| Maximum | 48.7% | 29.9% |
| Range | 38.4% | 28.7% |
| Mean | 20.9% | 11.3% |
| Median | 18.7% | 9.4% |
| Interquartile 25% (IQ1) | 14.7% | 6.8% |
| Interquartile 75% (IQ3) | 24.8% | 14.4% |
| Interquartile Range (IQR) | 10.1% | 7.6% |
| Standard Deviation (Sample) | 8.2% | 6.8% |
| Standard Deviation (Population) | 8.1% | 6.7% |
Similar Demographics by Receiving Food Stamps
Demographics Similar to Haitians by Receiving Food Stamps
In terms of receiving food stamps, the demographic groups most similar to Haitians are Immigrants from Grenada (17.8%, a difference of 0.010%), British West Indian (17.9%, a difference of 0.59%), Immigrants from Haiti (18.2%, a difference of 2.4%), Cuban (18.2%, a difference of 2.5%), and Apache (18.3%, a difference of 2.8%).
| Demographics | Rating | Rank | Receiving Food Stamps |
| Central American Indians | 0.0 /100 | #316 | Tragic 17.1% |
| Blacks/African Americans | 0.0 /100 | #317 | Tragic 17.2% |
| Menominee | 0.0 /100 | #318 | Tragic 17.2% |
| Immigrants | St. Vincent and the Grenadines | 0.0 /100 | #319 | Tragic 17.2% |
| Immigrants | Nicaragua | 0.0 /100 | #320 | Tragic 17.2% |
| Natives/Alaskans | 0.0 /100 | #321 | Tragic 17.3% |
| Immigrants | Grenada | 0.0 /100 | #322 | Tragic 17.8% |
| Haitians | 0.0 /100 | #323 | Tragic 17.8% |
| British West Indians | 0.0 /100 | #324 | Tragic 17.9% |
| Immigrants | Haiti | 0.0 /100 | #325 | Tragic 18.2% |
| Cubans | 0.0 /100 | #326 | Tragic 18.2% |
| Apache | 0.0 /100 | #327 | Tragic 18.3% |
| Colville | 0.0 /100 | #328 | Tragic 18.3% |
| Immigrants | Dominica | 0.0 /100 | #329 | Tragic 18.4% |
| Pima | 0.0 /100 | #330 | Tragic 19.0% |
Demographics Similar to Carpatho Rusyns by Receiving Food Stamps
In terms of receiving food stamps, the demographic groups most similar to Carpatho Rusyns are Korean (10.4%, a difference of 0.030%), Immigrants from Pakistan (10.4%, a difference of 0.040%), Immigrants from Italy (10.4%, a difference of 0.19%), Immigrants from Malaysia (10.4%, a difference of 0.27%), and Pakistani (10.4%, a difference of 0.33%).
| Demographics | Rating | Rank | Receiving Food Stamps |
| Palestinians | 96.9 /100 | #101 | Exceptional 10.3% |
| Immigrants | Europe | 96.8 /100 | #102 | Exceptional 10.3% |
| Immigrants | Latvia | 96.8 /100 | #103 | Exceptional 10.3% |
| Immigrants | Hungary | 96.7 /100 | #104 | Exceptional 10.3% |
| Immigrants | Malaysia | 96.5 /100 | #105 | Exceptional 10.4% |
| Immigrants | Italy | 96.4 /100 | #106 | Exceptional 10.4% |
| Koreans | 96.3 /100 | #107 | Exceptional 10.4% |
| Carpatho Rusyns | 96.2 /100 | #108 | Exceptional 10.4% |
| Immigrants | Pakistan | 96.2 /100 | #109 | Exceptional 10.4% |
| Pakistanis | 95.9 /100 | #110 | Exceptional 10.4% |
| Romanians | 95.8 /100 | #111 | Exceptional 10.4% |
| Mongolians | 95.8 /100 | #112 | Exceptional 10.5% |
| Icelanders | 95.4 /100 | #113 | Exceptional 10.5% |
| Scotch-Irish | 95.1 /100 | #114 | Exceptional 10.5% |
| Immigrants | Saudi Arabia | 94.9 /100 | #115 | Exceptional 10.5% |