French vs Immigrants from Uzbekistan Family Poverty
COMPARE
French
Immigrants from Uzbekistan
Family Poverty
Family Poverty Comparison
French
Immigrants from Uzbekistan
8.3%
FAMILY POVERTY
92.8/ 100
METRIC RATING
119th/ 347
METRIC RANK
10.0%
FAMILY POVERTY
3.1/ 100
METRIC RATING
229th/ 347
METRIC RANK
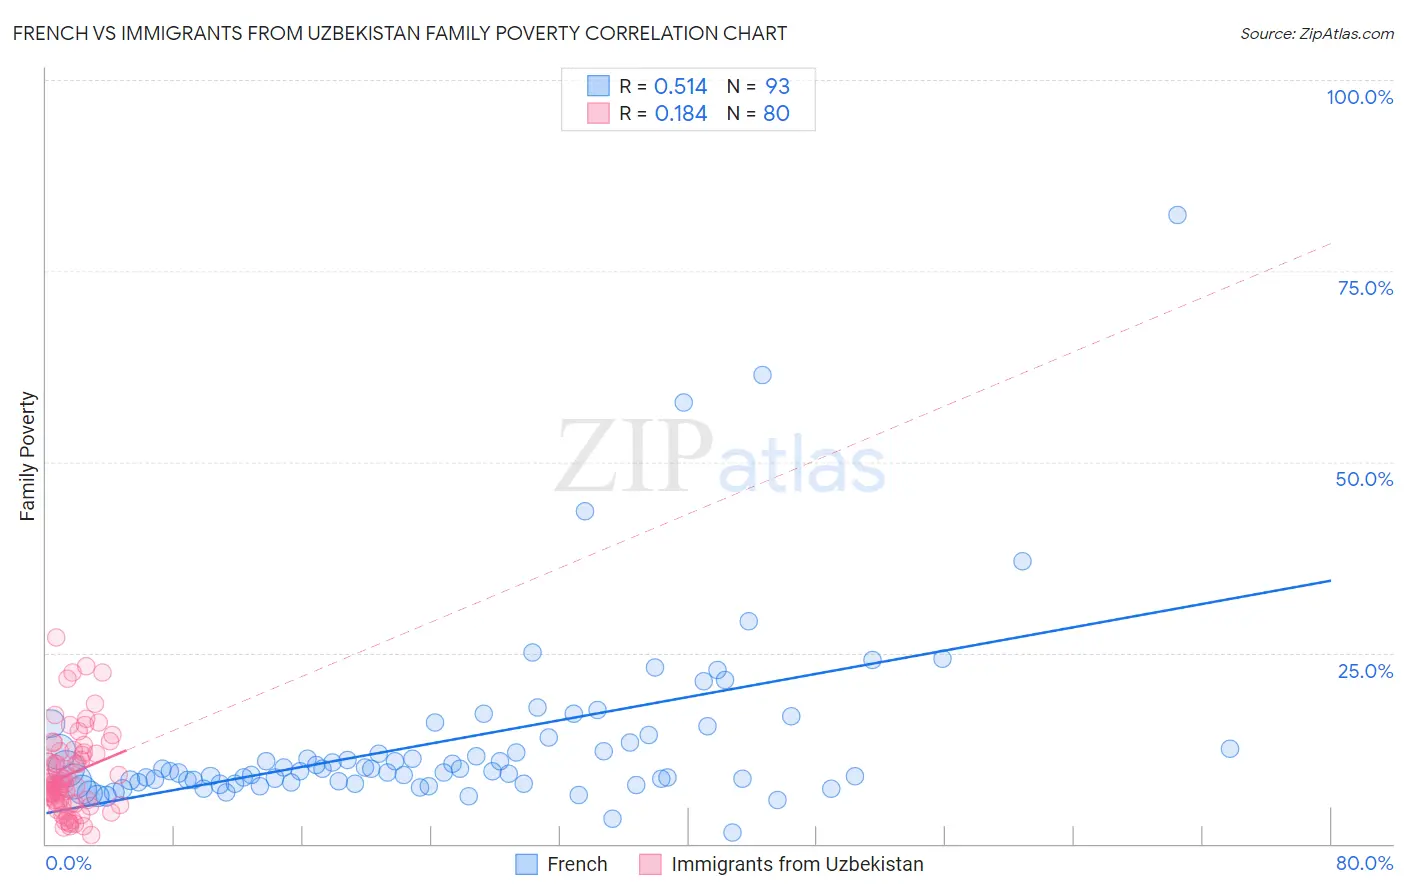
French vs Immigrants from Uzbekistan Family Poverty Correlation Chart
The statistical analysis conducted on geographies consisting of 567,554,801 people shows a substantial positive correlation between the proportion of French and poverty level among families in the United States with a correlation coefficient (R) of 0.514 and weighted average of 8.3%. Similarly, the statistical analysis conducted on geographies consisting of 118,666,742 people shows a poor positive correlation between the proportion of Immigrants from Uzbekistan and poverty level among families in the United States with a correlation coefficient (R) of 0.184 and weighted average of 10.0%, a difference of 21.4%.
Family Poverty Correlation Summary
| Measurement | French | Immigrants from Uzbekistan |
| Minimum | 1.5% | 1.2% |
| Maximum | 82.4% | 27.0% |
| Range | 80.9% | 25.8% |
| Mean | 13.4% | 9.1% |
| Median | 9.6% | 7.8% |
| Interquartile 25% (IQ1) | 8.0% | 5.3% |
| Interquartile 75% (IQ3) | 13.6% | 11.9% |
| Interquartile Range (IQR) | 5.6% | 6.5% |
| Standard Deviation (Sample) | 12.0% | 5.4% |
| Standard Deviation (Population) | 11.9% | 5.4% |
Similar Demographics by Family Poverty
Demographics Similar to French by Family Poverty
In terms of family poverty, the demographic groups most similar to French are Immigrants from Western Europe (8.2%, a difference of 0.070%), Immigrants from Russia (8.2%, a difference of 0.26%), South African (8.2%, a difference of 0.33%), Immigrants from Israel (8.2%, a difference of 0.39%), and Immigrants from Egypt (8.3%, a difference of 0.56%).
| Demographics | Rating | Rank | Family Poverty |
| Immigrants | France | 94.4 /100 | #112 | Exceptional 8.2% |
| Canadians | 94.2 /100 | #113 | Exceptional 8.2% |
| Immigrants | Zimbabwe | 94.0 /100 | #114 | Exceptional 8.2% |
| Immigrants | Israel | 93.5 /100 | #115 | Exceptional 8.2% |
| South Africans | 93.4 /100 | #116 | Exceptional 8.2% |
| Immigrants | Russia | 93.2 /100 | #117 | Exceptional 8.2% |
| Immigrants | Western Europe | 92.9 /100 | #118 | Exceptional 8.2% |
| French | 92.8 /100 | #119 | Exceptional 8.3% |
| Immigrants | Egypt | 91.6 /100 | #120 | Exceptional 8.3% |
| Native Hawaiians | 91.3 /100 | #121 | Exceptional 8.3% |
| Paraguayans | 91.2 /100 | #122 | Exceptional 8.3% |
| Palestinians | 91.1 /100 | #123 | Exceptional 8.3% |
| Soviet Union | 90.8 /100 | #124 | Exceptional 8.3% |
| Pakistanis | 90.8 /100 | #125 | Exceptional 8.3% |
| Icelanders | 90.3 /100 | #126 | Exceptional 8.3% |
Demographics Similar to Immigrants from Uzbekistan by Family Poverty
In terms of family poverty, the demographic groups most similar to Immigrants from Uzbekistan are Sudanese (10.0%, a difference of 0.010%), Immigrants from Panama (10.0%, a difference of 0.020%), Immigrants from Armenia (10.0%, a difference of 0.21%), Ottawa (10.0%, a difference of 0.23%), and Alaskan Athabascan (10.1%, a difference of 0.40%).
| Demographics | Rating | Rank | Family Poverty |
| Japanese | 4.8 /100 | #222 | Tragic 9.9% |
| Immigrants | Africa | 4.3 /100 | #223 | Tragic 9.9% |
| Marshallese | 3.9 /100 | #224 | Tragic 9.9% |
| Immigrants | Immigrants | 3.6 /100 | #225 | Tragic 10.0% |
| Ottawa | 3.3 /100 | #226 | Tragic 10.0% |
| Immigrants | Armenia | 3.3 /100 | #227 | Tragic 10.0% |
| Sudanese | 3.1 /100 | #228 | Tragic 10.0% |
| Immigrants | Uzbekistan | 3.1 /100 | #229 | Tragic 10.0% |
| Immigrants | Panama | 3.1 /100 | #230 | Tragic 10.0% |
| Alaskan Athabascans | 2.7 /100 | #231 | Tragic 10.1% |
| Immigrants | Sudan | 2.3 /100 | #232 | Tragic 10.1% |
| Fijians | 2.1 /100 | #233 | Tragic 10.1% |
| Immigrants | Middle Africa | 2.1 /100 | #234 | Tragic 10.1% |
| Nigerians | 2.0 /100 | #235 | Tragic 10.1% |
| Immigrants | Nigeria | 1.9 /100 | #236 | Tragic 10.2% |