French vs Czechoslovakian Family Poverty

COMPARE

French
Race
Ancestry
AfghanAfricanAlaska NativeAlaskan AthabascanAlbanianAleutAlsatianAmericanApacheArabArapahoArgentineanArmenianAssyrian/Chaldean/SyriacAustralianAustrianBahamianBangladeshiBarbadianBasqueBelgianBelizeanBermudanBhutaneseBlackfeetBolivianBrazilianBritishBritish West IndianBulgarianBurmeseCajunCambodianCanadianCape VerdeanCarpatho RusynCelticCentral AmericanCentral American IndianCherokeeCheyenneChickasawChileanChineseChippewaChoctawColombianColvilleComancheCosta RicanCreeCreekCroatianCrowCubanCypriotCzechDanishDelawareDominicanDutchDutch West IndianEastern EuropeanEcuadorianEgyptianEnglishEstonianEthiopianEuropeanFijianFilipinoFinnishFrenchFrench American IndianFrench CanadianGermanGerman RussianGhanaianGreekGuamanian/ChamorroGuatemalanGuyaneseHaitianHmongHonduranHopiHoumaHungarianIcelanderIndian (Asian)IndonesianInupiatIranianIraqiIrishIroquoisIsraeliItalianJamaicanJapaneseJordanianKenyanKiowaKoreanLaotianLatvianLebaneseLiberianLithuanianLumbeeLuxembourgerMacedonianMalaysianMalteseMarshalleseMenomineeMexicanMexican American IndianMongolianMoroccanNative HawaiianNavajoNepaleseNew ZealanderNicaraguanNigerianNorthern EuropeanNorwegianOkinawanOsageOttawaPaiutePakistaniPalestinianPanamanianParaguayanPennsylvania GermanPeruvianPimaPolishPortuguesePotawatomiPuebloPuerto RicanPuget Sound SalishRomanianRussianSalvadoranSamoanScandinavianScotch-IrishScottishSeminoleSenegaleseSerbianShoshoneSierra LeoneanSiouxSlavicSlovakSloveneSomaliSouth AfricanSouth AmericanSouth American IndianSoviet UnionSpaniardSpanishSpanish AmericanSpanish American IndianSri LankanSubsaharan AfricanSudaneseSwedishSwissSyrianTaiwaneseThaiTlingit-HaidaTohono O'OdhamTonganTrinidadian and TobagonianTsimshianTurkishU.S. Virgin IslanderUgandanUkrainianUruguayanUteVenezuelanVietnameseWelshWest IndianYakamaYaquiYugoslavianYumanYup'ikZimbabwean
Immigration
NonimmigrantsImmigrantsAfghanistanAfricaAlbaniaArgentinaArmeniaAsiaAustraliaAustriaBahamasBangladeshBarbadosBelarusBelgiumBelizeBoliviaBosnia and HerzegovinaBrazilBulgariaBurma/MyanmarCabo VerdeCambodiaCameroonCanadaCaribbeanCentral AmericaChileChinaColombiaCongoCosta RicaCroatiaCubaCzechoslovakiaDenmarkDominicaDominican RepublicEastern AfricaEastern AsiaEastern EuropeEcuadorEgyptEl SalvadorEnglandEritreaEthiopiaEuropeFijiFranceGermanyGhanaGreeceGrenadaGuatemalaGuyanaHaitiHondurasHong KongHungaryIndiaIndonesiaIranIraqIrelandIsraelItalyJamaicaJapanJordanKazakhstanKenyaKoreaKuwaitLaosLatin AmericaLatviaLebanonLiberiaLithuaniaMalaysiaMexicoMicronesiaMiddle AfricaMoldovaMoroccoNepalNetherlandsNicaraguaNigeriaNorth AmericaNorth MacedoniaNorthern AfricaNorthern EuropeNorwayOceaniaPakistanPanamaPeruPhilippinesPolandPortugalRomaniaRussiaSaudi ArabiaScotlandSenegalSerbiaSierra LeoneSingaporeSomaliaSouth AfricaSouth AmericaSouth Central AsiaSouth Eastern AsiaSouthern EuropeSpainSri LankaSt. Vincent and the GrenadinesSudanSwedenSwitzerlandSyriaTaiwanThailandTrinidad and TobagoTurkeyUgandaUkraineUruguayUzbekistanVenezuelaVietnamWest IndiesWestern AfricaWestern AsiaWestern EuropeYemenZaireZimbabweAzores
Czechoslovakian
Race
Ancestry
AfghanAfricanAlaska NativeAlaskan AthabascanAlbanianAleutAlsatianAmericanApacheArabArapahoArgentineanArmenianAssyrian/Chaldean/SyriacAustralianAustrianBahamianBangladeshiBarbadianBasqueBelgianBelizeanBermudanBhutaneseBlackfeetBolivianBrazilianBritishBritish West IndianBulgarianBurmeseCajunCambodianCanadianCape VerdeanCarpatho RusynCelticCentral AmericanCentral American IndianCherokeeCheyenneChickasawChileanChineseChippewaChoctawColombianColvilleComancheCosta RicanCreeCreekCroatianCrowCubanCypriotCzechCzechoslovakianDanishDelawareDominicanDutchDutch West IndianEastern EuropeanEcuadorianEgyptianEnglishEstonianEthiopianEuropeanFijianFilipinoFinnishFrench American IndianFrench CanadianGermanGerman RussianGhanaianGreekGuamanian/ChamorroGuatemalanGuyaneseHaitianHmongHonduranHopiHoumaHungarianIcelanderIndian (Asian)IndonesianInupiatIranianIraqiIrishIroquoisIsraeliItalianJamaicanJapaneseJordanianKenyanKiowaKoreanLaotianLatvianLebaneseLiberianLithuanianLumbeeLuxembourgerMacedonianMalaysianMalteseMarshalleseMenomineeMexicanMexican American IndianMongolianMoroccanNative HawaiianNavajoNepaleseNew ZealanderNicaraguanNigerianNorthern EuropeanNorwegianOkinawanOsageOttawaPaiutePakistaniPalestinianPanamanianParaguayanPennsylvania GermanPeruvianPimaPolishPortuguesePotawatomiPuebloPuerto RicanPuget Sound SalishRomanianRussianSalvadoranSamoanScandinavianScotch-IrishScottishSeminoleSenegaleseSerbianShoshoneSierra LeoneanSiouxSlavicSlovakSloveneSomaliSouth AfricanSouth AmericanSouth American IndianSoviet UnionSpaniardSpanishSpanish AmericanSpanish American IndianSri LankanSubsaharan AfricanSudaneseSwedishSwissSyrianTaiwaneseThaiTlingit-HaidaTohono O'OdhamTonganTrinidadian and TobagonianTsimshianTurkishU.S. Virgin IslanderUgandanUkrainianUruguayanUteVenezuelanVietnameseWelshWest IndianYakamaYaquiYugoslavianYumanYup'ikZimbabwean
Immigration
NonimmigrantsImmigrantsAfghanistanAfricaAlbaniaArgentinaArmeniaAsiaAustraliaAustriaBahamasBangladeshBarbadosBelarusBelgiumBelizeBoliviaBosnia and HerzegovinaBrazilBulgariaBurma/MyanmarCabo VerdeCambodiaCameroonCanadaCaribbeanCentral AmericaChileChinaColombiaCongoCosta RicaCroatiaCubaCzechoslovakiaDenmarkDominicaDominican RepublicEastern AfricaEastern AsiaEastern EuropeEcuadorEgyptEl SalvadorEnglandEritreaEthiopiaEuropeFijiFranceGermanyGhanaGreeceGrenadaGuatemalaGuyanaHaitiHondurasHong KongHungaryIndiaIndonesiaIranIraqIrelandIsraelItalyJamaicaJapanJordanKazakhstanKenyaKoreaKuwaitLaosLatin AmericaLatviaLebanonLiberiaLithuaniaMalaysiaMexicoMicronesiaMiddle AfricaMoldovaMoroccoNepalNetherlandsNicaraguaNigeriaNorth AmericaNorth MacedoniaNorthern AfricaNorthern EuropeNorwayOceaniaPakistanPanamaPeruPhilippinesPolandPortugalRomaniaRussiaSaudi ArabiaScotlandSenegalSerbiaSierra LeoneSingaporeSomaliaSouth AfricaSouth AmericaSouth Central AsiaSouth Eastern AsiaSouthern EuropeSpainSri LankaSt. Vincent and the GrenadinesSudanSwedenSwitzerlandSyriaTaiwanThailandTrinidad and TobagoTurkeyUgandaUkraineUruguayUzbekistanVenezuelaVietnamWest IndiesWestern AfricaWestern AsiaWestern EuropeYemenZaireZimbabweAzores
Family Poverty
Income
Poverty
Unemployment
Labor Participation
Family Structure
Vehicle Availability
Education Level
Disability

Family Poverty Comparison

French

Czechoslovakians

Exceptional
Exceptional
8.3%
FAMILY POVERTY
92.8/ 100
METRIC RATING
119th/ 347
METRIC RANK
8.0%
FAMILY POVERTY
96.8/ 100
METRIC RATING
92nd/ 347
METRIC RANK

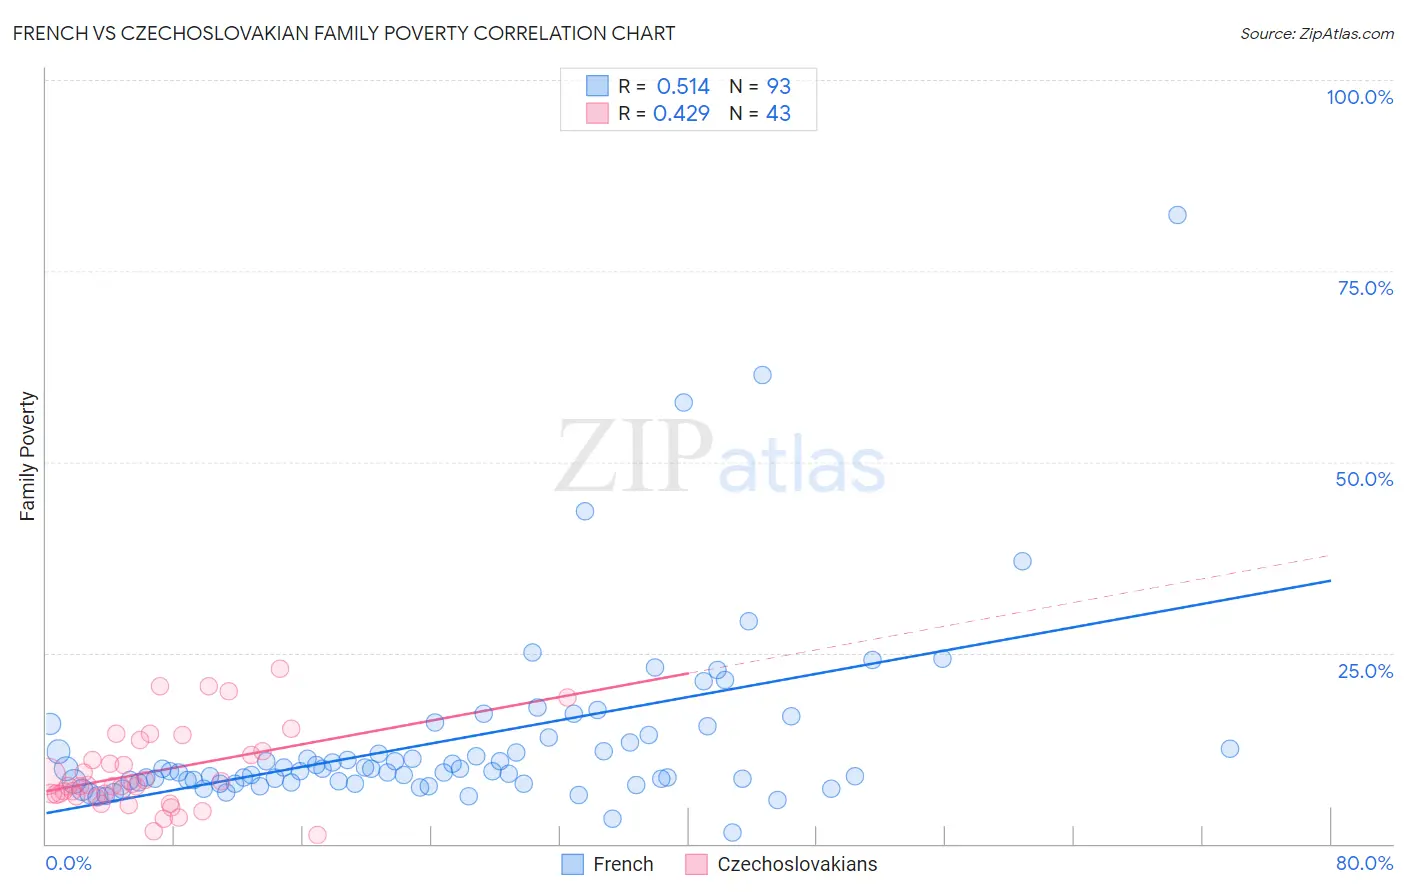
French vs Czechoslovakian Family Poverty Correlation Chart

The statistical analysis conducted on geographies consisting of 567,554,801 people shows a substantial positive correlation between the proportion of French and poverty level among families in the United States with a correlation coefficient (R) of 0.514 and weighted average of 8.3%. Similarly, the statistical analysis conducted on geographies consisting of 367,669,162 people shows a moderate positive correlation between the proportion of Czechoslovakians and poverty level among families in the United States with a correlation coefficient (R) of 0.429 and weighted average of 8.0%, a difference of 3.2%.
French vs Czechoslovakian Family Poverty

Family Poverty Correlation Summary

MeasurementFrenchCzechoslovakian
Minimum1.5%1.1%
Maximum82.4%23.0%
Range80.9%21.9%
Mean13.4%9.4%
Median9.6%7.6%
Interquartile 25% (IQ1)8.0%6.2%
Interquartile 75% (IQ3)13.6%12.1%
Interquartile Range (IQR)5.6%5.9%
Standard Deviation (Sample)12.0%5.3%
Standard Deviation (Population)11.9%5.2%

Similar Demographics by Family Poverty

Demographics Similar to French by Family Poverty

In terms of family poverty, the demographic groups most similar to French are Immigrants from Western Europe (8.2%, a difference of 0.070%), Immigrants from Russia (8.2%, a difference of 0.26%), South African (8.2%, a difference of 0.33%), Immigrants from Israel (8.2%, a difference of 0.39%), and Immigrants from Egypt (8.3%, a difference of 0.56%).
DemographicsRating | RankFamily Poverty
Immigrants | France
94.4
/100
|
#112
Exceptional
8.2%
Canadians
94.2
/100
|
#113
Exceptional
8.2%
Immigrants | Zimbabwe
94.0
/100
|
#114
Exceptional
8.2%
Immigrants | Israel
93.5
/100
|
#115
Exceptional
8.2%
South Africans
93.4
/100
|
#116
Exceptional
8.2%
Immigrants | Russia
93.2
/100
|
#117
Exceptional
8.2%
Immigrants | Western Europe
92.9
/100
|
#118
Exceptional
8.2%
French
92.8
/100
|
#119
Exceptional
8.3%
Immigrants | Egypt
91.6
/100
|
#120
Exceptional
8.3%
Native Hawaiians
91.3
/100
|
#121
Exceptional
8.3%
Paraguayans
91.2
/100
|
#122
Exceptional
8.3%
Palestinians
91.1
/100
|
#123
Exceptional
8.3%
Soviet Union
90.8
/100
|
#124
Exceptional
8.3%
Pakistanis
90.8
/100
|
#125
Exceptional
8.3%
Icelanders
90.3
/100
|
#126
Exceptional
8.3%

Demographics Similar to Czechoslovakians by Family Poverty

In terms of family poverty, the demographic groups most similar to Czechoslovakians are Tlingit-Haida (8.0%, a difference of 0.18%), Immigrants from Italy (8.0%, a difference of 0.24%), Immigrants from Pakistan (8.0%, a difference of 0.29%), Immigrants from Philippines (8.0%, a difference of 0.30%), and Immigrants from Turkey (8.0%, a difference of 0.32%).
DemographicsRating | RankFamily Poverty
Immigrants | Asia
97.4
/100
|
#85
Exceptional
7.9%
Scottish
97.3
/100
|
#86
Exceptional
7.9%
Belgians
97.3
/100
|
#87
Exceptional
8.0%
Serbians
97.2
/100
|
#88
Exceptional
8.0%
Immigrants | Denmark
97.1
/100
|
#89
Exceptional
8.0%
Immigrants | England
97.1
/100
|
#90
Exceptional
8.0%
Immigrants | Italy
97.0
/100
|
#91
Exceptional
8.0%
Czechoslovakians
96.8
/100
|
#92
Exceptional
8.0%
Tlingit-Haida
96.7
/100
|
#93
Exceptional
8.0%
Immigrants | Pakistan
96.6
/100
|
#94
Exceptional
8.0%
Immigrants | Philippines
96.5
/100
|
#95
Exceptional
8.0%
Immigrants | Turkey
96.5
/100
|
#96
Exceptional
8.0%
Immigrants | Switzerland
96.1
/100
|
#97
Exceptional
8.1%
Immigrants | South Africa
95.9
/100
|
#98
Exceptional
8.1%
Welsh
95.8
/100
|
#99
Exceptional
8.1%