French vs Immigrants from Afghanistan Family Poverty

COMPARE

French
Race
Ancestry
AfghanAfricanAlaska NativeAlaskan AthabascanAlbanianAleutAlsatianAmericanApacheArabArapahoArgentineanArmenianAssyrian/Chaldean/SyriacAustralianAustrianBahamianBangladeshiBarbadianBasqueBelgianBelizeanBermudanBhutaneseBlackfeetBolivianBrazilianBritishBritish West IndianBulgarianBurmeseCajunCambodianCanadianCape VerdeanCarpatho RusynCelticCentral AmericanCentral American IndianCherokeeCheyenneChickasawChileanChineseChippewaChoctawColombianColvilleComancheCosta RicanCreeCreekCroatianCrowCubanCypriotCzechCzechoslovakianDanishDelawareDominicanDutchDutch West IndianEastern EuropeanEcuadorianEgyptianEnglishEstonianEthiopianEuropeanFijianFilipinoFinnishFrenchFrench American IndianFrench CanadianGermanGerman RussianGhanaianGreekGuamanian/ChamorroGuatemalanGuyaneseHaitianHmongHonduranHopiHoumaHungarianIcelanderIndian (Asian)IndonesianInupiatIranianIraqiIrishIroquoisIsraeliItalianJamaicanJapaneseJordanianKenyanKiowaKoreanLaotianLatvianLebaneseLiberianLithuanianLumbeeLuxembourgerMacedonianMalaysianMalteseMarshalleseMenomineeMexicanMexican American IndianMongolianMoroccanNative HawaiianNavajoNepaleseNew ZealanderNicaraguanNigerianNorthern EuropeanNorwegianOkinawanOsageOttawaPaiutePakistaniPalestinianPanamanianParaguayanPennsylvania GermanPeruvianPimaPolishPortuguesePotawatomiPuebloPuerto RicanPuget Sound SalishRomanianRussianSalvadoranSamoanScandinavianScotch-IrishScottishSeminoleSenegaleseSerbianShoshoneSierra LeoneanSiouxSlavicSlovakSloveneSomaliSouth AfricanSouth AmericanSouth American IndianSoviet UnionSpaniardSpanishSpanish AmericanSpanish American IndianSri LankanSubsaharan AfricanSudaneseSwedishSwissSyrianTaiwaneseThaiTlingit-HaidaTohono O'OdhamTonganTrinidadian and TobagonianTsimshianTurkishU.S. Virgin IslanderUgandanUkrainianUruguayanUteVenezuelanVietnameseWelshWest IndianYakamaYaquiYugoslavianYumanYup'ikZimbabwean
Immigration
NonimmigrantsImmigrantsAfricaAlbaniaArgentinaArmeniaAsiaAustraliaAustriaBahamasBangladeshBarbadosBelarusBelgiumBelizeBoliviaBosnia and HerzegovinaBrazilBulgariaBurma/MyanmarCabo VerdeCambodiaCameroonCanadaCaribbeanCentral AmericaChileChinaColombiaCongoCosta RicaCroatiaCubaCzechoslovakiaDenmarkDominicaDominican RepublicEastern AfricaEastern AsiaEastern EuropeEcuadorEgyptEl SalvadorEnglandEritreaEthiopiaEuropeFijiFranceGermanyGhanaGreeceGrenadaGuatemalaGuyanaHaitiHondurasHong KongHungaryIndiaIndonesiaIranIraqIrelandIsraelItalyJamaicaJapanJordanKazakhstanKenyaKoreaKuwaitLaosLatin AmericaLatviaLebanonLiberiaLithuaniaMalaysiaMexicoMicronesiaMiddle AfricaMoldovaMoroccoNepalNetherlandsNicaraguaNigeriaNorth AmericaNorth MacedoniaNorthern AfricaNorthern EuropeNorwayOceaniaPakistanPanamaPeruPhilippinesPolandPortugalRomaniaRussiaSaudi ArabiaScotlandSenegalSerbiaSierra LeoneSingaporeSomaliaSouth AfricaSouth AmericaSouth Central AsiaSouth Eastern AsiaSouthern EuropeSpainSri LankaSt. Vincent and the GrenadinesSudanSwedenSwitzerlandSyriaTaiwanThailandTrinidad and TobagoTurkeyUgandaUkraineUruguayUzbekistanVenezuelaVietnamWest IndiesWestern AfricaWestern AsiaWestern EuropeYemenZaireZimbabweAzores
Immigrants from Afghanistan
Race
Ancestry
AfghanAfricanAlaska NativeAlaskan AthabascanAlbanianAleutAlsatianAmericanApacheArabArapahoArgentineanArmenianAssyrian/Chaldean/SyriacAustralianAustrianBahamianBangladeshiBarbadianBasqueBelgianBelizeanBermudanBhutaneseBlackfeetBolivianBrazilianBritishBritish West IndianBulgarianBurmeseCajunCambodianCanadianCape VerdeanCarpatho RusynCelticCentral AmericanCentral American IndianCherokeeCheyenneChickasawChileanChineseChippewaChoctawColombianColvilleComancheCosta RicanCreeCreekCroatianCrowCubanCypriotCzechCzechoslovakianDanishDelawareDominicanDutchDutch West IndianEastern EuropeanEcuadorianEgyptianEnglishEstonianEthiopianEuropeanFijianFilipinoFinnishFrench American IndianFrench CanadianGermanGerman RussianGhanaianGreekGuamanian/ChamorroGuatemalanGuyaneseHaitianHmongHonduranHopiHoumaHungarianIcelanderIndian (Asian)IndonesianInupiatIranianIraqiIrishIroquoisIsraeliItalianJamaicanJapaneseJordanianKenyanKiowaKoreanLaotianLatvianLebaneseLiberianLithuanianLumbeeLuxembourgerMacedonianMalaysianMalteseMarshalleseMenomineeMexicanMexican American IndianMongolianMoroccanNative HawaiianNavajoNepaleseNew ZealanderNicaraguanNigerianNorthern EuropeanNorwegianOkinawanOsageOttawaPaiutePakistaniPalestinianPanamanianParaguayanPennsylvania GermanPeruvianPimaPolishPortuguesePotawatomiPuebloPuerto RicanPuget Sound SalishRomanianRussianSalvadoranSamoanScandinavianScotch-IrishScottishSeminoleSenegaleseSerbianShoshoneSierra LeoneanSiouxSlavicSlovakSloveneSomaliSouth AfricanSouth AmericanSouth American IndianSoviet UnionSpaniardSpanishSpanish AmericanSpanish American IndianSri LankanSubsaharan AfricanSudaneseSwedishSwissSyrianTaiwaneseThaiTlingit-HaidaTohono O'OdhamTonganTrinidadian and TobagonianTsimshianTurkishU.S. Virgin IslanderUgandanUkrainianUruguayanUteVenezuelanVietnameseWelshWest IndianYakamaYaquiYugoslavianYumanYup'ikZimbabwean
Immigration
NonimmigrantsImmigrantsAfghanistanAfricaAlbaniaArgentinaArmeniaAsiaAustraliaAustriaBahamasBangladeshBarbadosBelarusBelgiumBelizeBoliviaBosnia and HerzegovinaBrazilBulgariaBurma/MyanmarCabo VerdeCambodiaCameroonCanadaCaribbeanCentral AmericaChileChinaColombiaCongoCosta RicaCroatiaCubaCzechoslovakiaDenmarkDominicaDominican RepublicEastern AfricaEastern AsiaEastern EuropeEcuadorEgyptEl SalvadorEnglandEritreaEthiopiaEuropeFijiFranceGermanyGhanaGreeceGrenadaGuatemalaGuyanaHaitiHondurasHong KongHungaryIndiaIndonesiaIranIraqIrelandIsraelItalyJamaicaJapanJordanKazakhstanKenyaKoreaKuwaitLaosLatin AmericaLatviaLebanonLiberiaLithuaniaMalaysiaMexicoMicronesiaMiddle AfricaMoldovaMoroccoNepalNetherlandsNicaraguaNigeriaNorth AmericaNorth MacedoniaNorthern AfricaNorthern EuropeNorwayOceaniaPakistanPanamaPeruPhilippinesPolandPortugalRomaniaRussiaSaudi ArabiaScotlandSenegalSerbiaSierra LeoneSingaporeSomaliaSouth AfricaSouth AmericaSouth Central AsiaSouth Eastern AsiaSouthern EuropeSpainSri LankaSt. Vincent and the GrenadinesSudanSwedenSwitzerlandSyriaTaiwanThailandTrinidad and TobagoTurkeyUgandaUkraineUruguayUzbekistanVenezuelaVietnamWest IndiesWestern AfricaWestern AsiaWestern EuropeYemenZaireZimbabweAzores
Family Poverty
Income
Poverty
Unemployment
Labor Participation
Family Structure
Vehicle Availability
Education Level
Disability

Family Poverty Comparison

French

Immigrants from Afghanistan

Exceptional
Fair
8.3%
FAMILY POVERTY
92.8/ 100
METRIC RATING
119th/ 347
METRIC RANK
9.2%
FAMILY POVERTY
32.1/ 100
METRIC RATING
189th/ 347
METRIC RANK

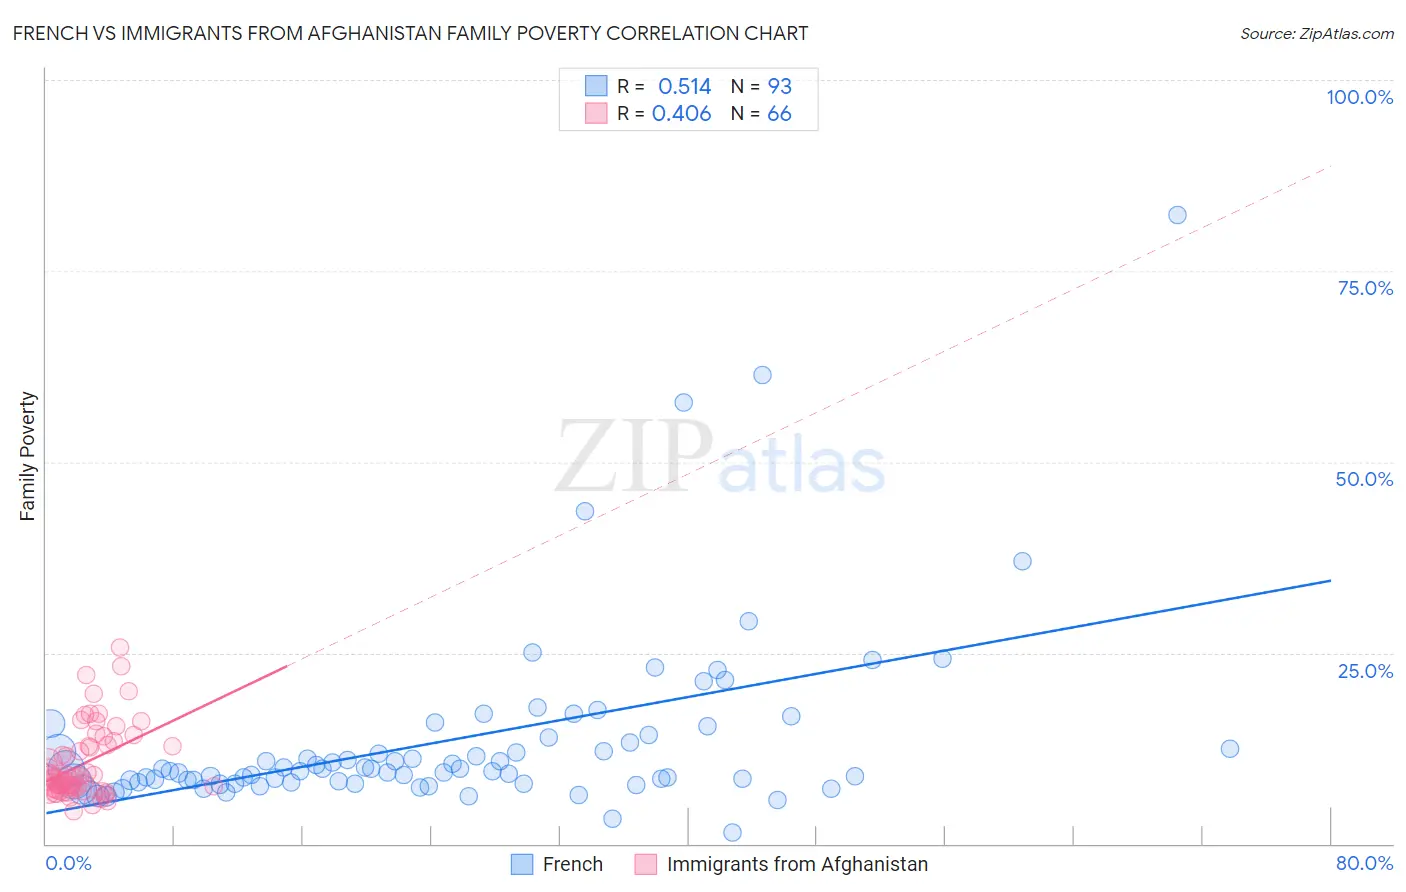
French vs Immigrants from Afghanistan Family Poverty Correlation Chart

The statistical analysis conducted on geographies consisting of 567,554,801 people shows a substantial positive correlation between the proportion of French and poverty level among families in the United States with a correlation coefficient (R) of 0.514 and weighted average of 8.3%. Similarly, the statistical analysis conducted on geographies consisting of 147,487,715 people shows a moderate positive correlation between the proportion of Immigrants from Afghanistan and poverty level among families in the United States with a correlation coefficient (R) of 0.406 and weighted average of 9.2%, a difference of 11.8%.
French vs Immigrants from Afghanistan Family Poverty

Family Poverty Correlation Summary

MeasurementFrenchImmigrants from Afghanistan
Minimum1.5%4.3%
Maximum82.4%25.6%
Range80.9%21.3%
Mean13.4%10.5%
Median9.6%8.6%
Interquartile 25% (IQ1)8.0%7.2%
Interquartile 75% (IQ3)13.6%12.9%
Interquartile Range (IQR)5.6%5.7%
Standard Deviation (Sample)12.0%4.7%
Standard Deviation (Population)11.9%4.7%

Similar Demographics by Family Poverty

Demographics Similar to French by Family Poverty

In terms of family poverty, the demographic groups most similar to French are Immigrants from Western Europe (8.2%, a difference of 0.070%), Immigrants from Russia (8.2%, a difference of 0.26%), South African (8.2%, a difference of 0.33%), Immigrants from Israel (8.2%, a difference of 0.39%), and Immigrants from Egypt (8.3%, a difference of 0.56%).
DemographicsRating | RankFamily Poverty
Immigrants | France
94.4
/100
|
#112
Exceptional
8.2%
Canadians
94.2
/100
|
#113
Exceptional
8.2%
Immigrants | Zimbabwe
94.0
/100
|
#114
Exceptional
8.2%
Immigrants | Israel
93.5
/100
|
#115
Exceptional
8.2%
South Africans
93.4
/100
|
#116
Exceptional
8.2%
Immigrants | Russia
93.2
/100
|
#117
Exceptional
8.2%
Immigrants | Western Europe
92.9
/100
|
#118
Exceptional
8.2%
French
92.8
/100
|
#119
Exceptional
8.3%
Immigrants | Egypt
91.6
/100
|
#120
Exceptional
8.3%
Native Hawaiians
91.3
/100
|
#121
Exceptional
8.3%
Paraguayans
91.2
/100
|
#122
Exceptional
8.3%
Palestinians
91.1
/100
|
#123
Exceptional
8.3%
Soviet Union
90.8
/100
|
#124
Exceptional
8.3%
Pakistanis
90.8
/100
|
#125
Exceptional
8.3%
Icelanders
90.3
/100
|
#126
Exceptional
8.3%

Demographics Similar to Immigrants from Afghanistan by Family Poverty

In terms of family poverty, the demographic groups most similar to Immigrants from Afghanistan are Arab (9.2%, a difference of 0.090%), Immigrants from Kenya (9.2%, a difference of 0.29%), Delaware (9.2%, a difference of 0.48%), Ugandan (9.3%, a difference of 0.50%), and Spanish (9.3%, a difference of 0.51%).
DemographicsRating | RankFamily Poverty
Immigrants | Morocco
40.2
/100
|
#182
Average
9.1%
Uruguayans
39.2
/100
|
#183
Fair
9.1%
South American Indians
38.7
/100
|
#184
Fair
9.1%
Immigrants | Saudi Arabia
38.6
/100
|
#185
Fair
9.1%
Colombians
36.1
/100
|
#186
Fair
9.2%
Delaware
35.4
/100
|
#187
Fair
9.2%
Immigrants | Kenya
34.0
/100
|
#188
Fair
9.2%
Immigrants | Afghanistan
32.1
/100
|
#189
Fair
9.2%
Arabs
31.5
/100
|
#190
Fair
9.2%
Ugandans
28.7
/100
|
#191
Fair
9.3%
Spanish
28.7
/100
|
#192
Fair
9.3%
Immigrants | Western Asia
28.2
/100
|
#193
Fair
9.3%
South Americans
28.1
/100
|
#194
Fair
9.3%
Venezuelans
27.4
/100
|
#195
Fair
9.3%
Immigrants | Venezuela
26.1
/100
|
#196
Fair
9.3%