Filipino vs Chippewa Poverty
COMPARE
Filipino
Chippewa
Poverty
Poverty Comparison
Filipinos
Chippewa
10.1%
POVERTY
99.9/ 100
METRIC RATING
7th/ 347
METRIC RANK
15.7%
POVERTY
0.0/ 100
METRIC RATING
311th/ 347
METRIC RANK
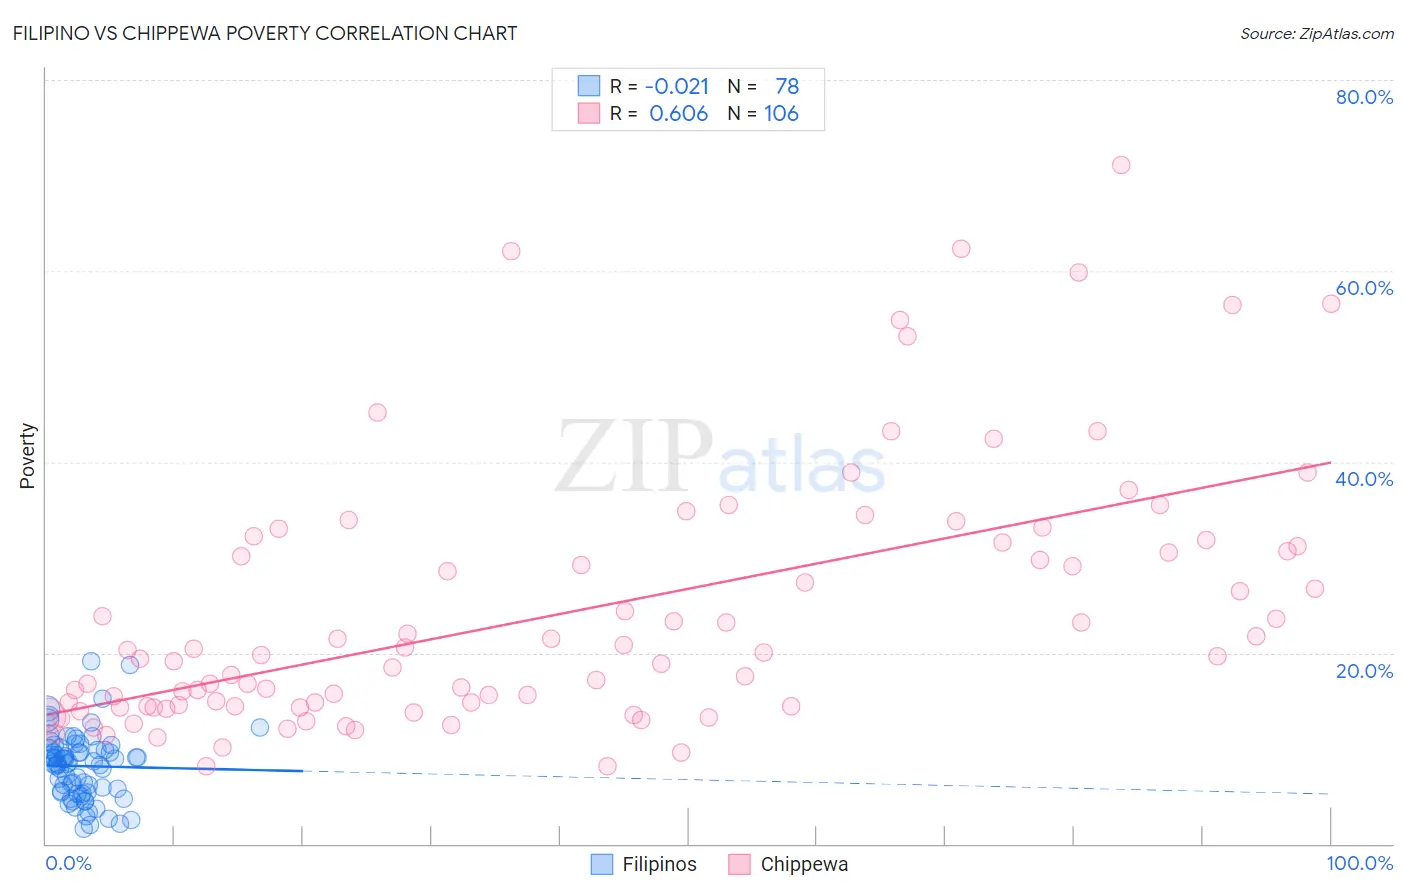
Filipino vs Chippewa Poverty Correlation Chart
The statistical analysis conducted on geographies consisting of 254,160,394 people shows no correlation between the proportion of Filipinos and poverty level in the United States with a correlation coefficient (R) of -0.021 and weighted average of 10.1%. Similarly, the statistical analysis conducted on geographies consisting of 215,014,776 people shows a significant positive correlation between the proportion of Chippewa and poverty level in the United States with a correlation coefficient (R) of 0.606 and weighted average of 15.7%, a difference of 55.0%.
Poverty Correlation Summary
| Measurement | Filipino | Chippewa |
| Minimum | 1.6% | 8.1% |
| Maximum | 19.2% | 71.1% |
| Range | 17.6% | 63.0% |
| Mean | 8.1% | 24.2% |
| Median | 8.4% | 19.7% |
| Interquartile 25% (IQ1) | 5.4% | 14.4% |
| Interquartile 75% (IQ3) | 9.9% | 31.1% |
| Interquartile Range (IQR) | 4.5% | 16.7% |
| Standard Deviation (Sample) | 3.5% | 13.5% |
| Standard Deviation (Population) | 3.5% | 13.4% |
Similar Demographics by Poverty
Demographics Similar to Filipinos by Poverty
In terms of poverty, the demographic groups most similar to Filipinos are Assyrian/Chaldean/Syriac (10.1%, a difference of 0.14%), Immigrants from Ireland (10.1%, a difference of 0.32%), Maltese (10.2%, a difference of 0.42%), Immigrants from South Central Asia (10.2%, a difference of 0.87%), and Bulgarian (10.2%, a difference of 1.3%).
| Demographics | Rating | Rank | Poverty |
| Immigrants | India | 100.0 /100 | #1 | Exceptional 9.0% |
| Chinese | 100.0 /100 | #2 | Exceptional 9.5% |
| Thais | 100.0 /100 | #3 | Exceptional 9.6% |
| Immigrants | Taiwan | 100.0 /100 | #4 | Exceptional 9.7% |
| Immigrants | Ireland | 99.9 /100 | #5 | Exceptional 10.1% |
| Assyrians/Chaldeans/Syriacs | 99.9 /100 | #6 | Exceptional 10.1% |
| Filipinos | 99.9 /100 | #7 | Exceptional 10.1% |
| Maltese | 99.9 /100 | #8 | Exceptional 10.2% |
| Immigrants | South Central Asia | 99.9 /100 | #9 | Exceptional 10.2% |
| Bulgarians | 99.9 /100 | #10 | Exceptional 10.2% |
| Immigrants | Lithuania | 99.9 /100 | #11 | Exceptional 10.3% |
| Bhutanese | 99.8 /100 | #12 | Exceptional 10.4% |
| Immigrants | Hong Kong | 99.8 /100 | #13 | Exceptional 10.4% |
| Immigrants | Bolivia | 99.8 /100 | #14 | Exceptional 10.4% |
| Bolivians | 99.8 /100 | #15 | Exceptional 10.4% |
Demographics Similar to Chippewa by Poverty
In terms of poverty, the demographic groups most similar to Chippewa are Cajun (15.7%, a difference of 0.16%), Dutch West Indian (15.6%, a difference of 0.39%), Seminole (15.6%, a difference of 0.48%), Choctaw (15.6%, a difference of 0.52%), and Immigrants from Grenada (15.8%, a difference of 0.60%).
| Demographics | Rating | Rank | Poverty |
| Immigrants | Mexico | 0.0 /100 | #304 | Tragic 15.5% |
| Immigrants | Guatemala | 0.0 /100 | #305 | Tragic 15.5% |
| Creek | 0.0 /100 | #306 | Tragic 15.6% |
| Africans | 0.0 /100 | #307 | Tragic 15.6% |
| Choctaw | 0.0 /100 | #308 | Tragic 15.6% |
| Seminole | 0.0 /100 | #309 | Tragic 15.6% |
| Dutch West Indians | 0.0 /100 | #310 | Tragic 15.6% |
| Chippewa | 0.0 /100 | #311 | Tragic 15.7% |
| Cajuns | 0.0 /100 | #312 | Tragic 15.7% |
| Immigrants | Grenada | 0.0 /100 | #313 | Tragic 15.8% |
| Immigrants | Somalia | 0.0 /100 | #314 | Tragic 15.8% |
| British West Indians | 0.0 /100 | #315 | Tragic 15.9% |
| Hondurans | 0.0 /100 | #316 | Tragic 15.9% |
| U.S. Virgin Islanders | 0.0 /100 | #317 | Tragic 16.1% |
| Immigrants | Dominica | 0.0 /100 | #318 | Tragic 16.1% |