Fijian vs Belizean Single Female Poverty
COMPARE
Fijian
Belizean
Single Female Poverty
Single Female Poverty Comparison
Fijians
Belizeans
23.1%
SINGLE FEMALE POVERTY
0.2/ 100
METRIC RATING
268th/ 347
METRIC RANK
22.4%
SINGLE FEMALE POVERTY
1.4/ 100
METRIC RATING
248th/ 347
METRIC RANK
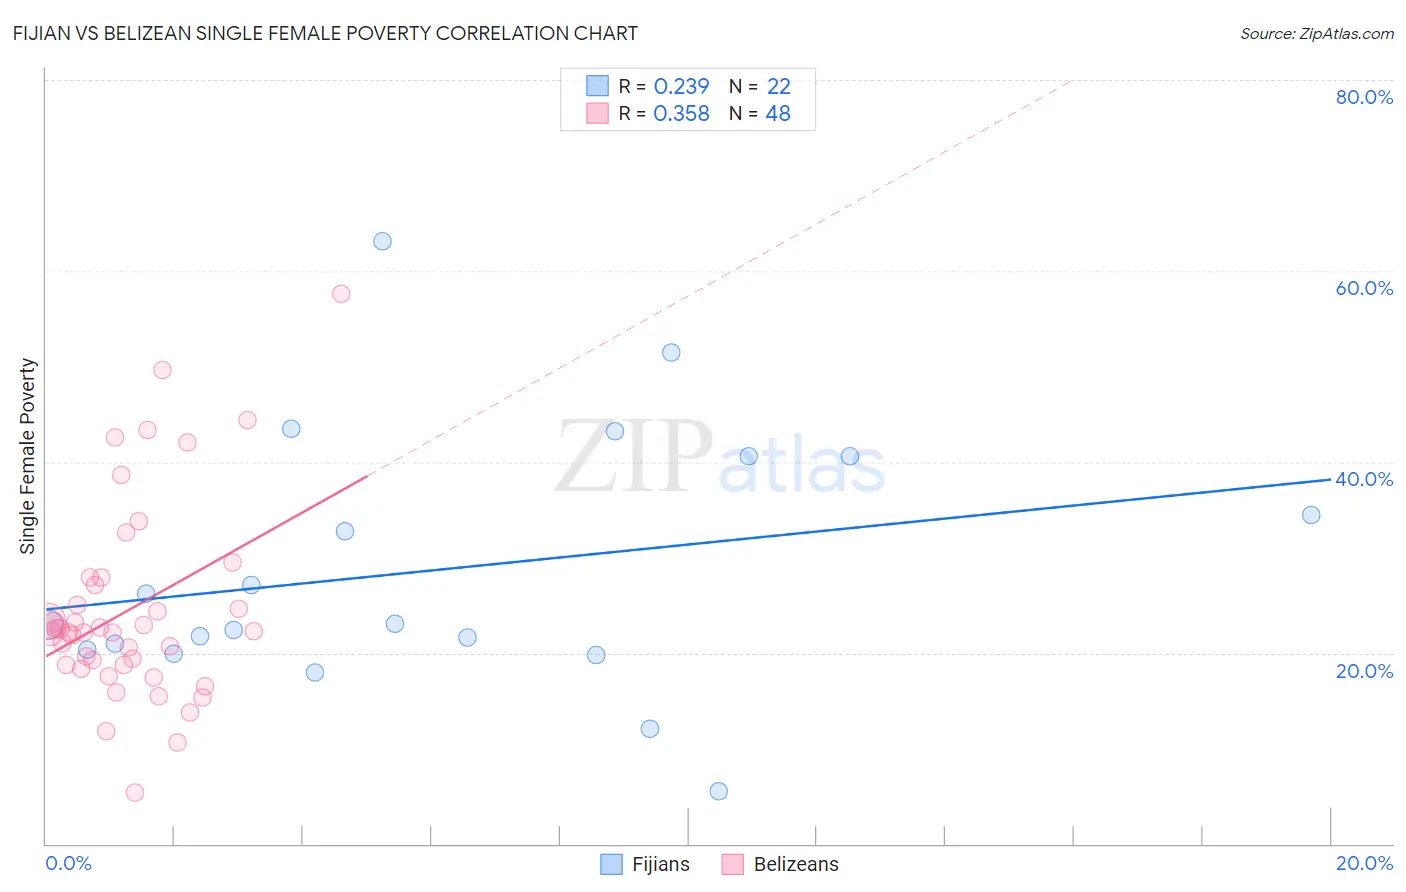
Fijian vs Belizean Single Female Poverty Correlation Chart
The statistical analysis conducted on geographies consisting of 55,892,814 people shows a weak positive correlation between the proportion of Fijians and poverty level among single females in the United States with a correlation coefficient (R) of 0.239 and weighted average of 23.1%. Similarly, the statistical analysis conducted on geographies consisting of 143,694,169 people shows a mild positive correlation between the proportion of Belizeans and poverty level among single females in the United States with a correlation coefficient (R) of 0.358 and weighted average of 22.4%, a difference of 2.9%.
Single Female Poverty Correlation Summary
| Measurement | Fijian | Belizean |
| Minimum | 5.6% | 5.4% |
| Maximum | 63.2% | 57.6% |
| Range | 57.6% | 52.3% |
| Mean | 28.7% | 24.6% |
| Median | 23.0% | 22.2% |
| Interquartile 25% (IQ1) | 20.3% | 18.7% |
| Interquartile 75% (IQ3) | 40.6% | 27.5% |
| Interquartile Range (IQR) | 20.3% | 8.8% |
| Standard Deviation (Sample) | 13.6% | 10.4% |
| Standard Deviation (Population) | 13.3% | 10.2% |
Demographics Similar to Fijians and Belizeans by Single Female Poverty
In terms of single female poverty, the demographic groups most similar to Fijians are Senegalese (23.0%, a difference of 0.070%), Immigrants from Micronesia (23.0%, a difference of 0.13%), Central American (23.0%, a difference of 0.34%), Immigrants from Laos (22.9%, a difference of 0.51%), and Scotch-Irish (22.9%, a difference of 0.58%). Similarly, the demographic groups most similar to Belizeans are Immigrants from Caribbean (22.4%, a difference of 0.10%), Immigrants from Bahamas (22.5%, a difference of 0.25%), Immigrants from West Indies (22.5%, a difference of 0.39%), Delaware (22.5%, a difference of 0.50%), and Immigrants from Liberia (22.5%, a difference of 0.60%).
| Demographics | Rating | Rank | Single Female Poverty |
| Belizeans | 1.4 /100 | #248 | Tragic 22.4% |
| Immigrants | Caribbean | 1.3 /100 | #249 | Tragic 22.4% |
| Immigrants | Bahamas | 1.2 /100 | #250 | Tragic 22.5% |
| Immigrants | West Indies | 1.0 /100 | #251 | Tragic 22.5% |
| Delaware | 1.0 /100 | #252 | Tragic 22.5% |
| Immigrants | Liberia | 0.9 /100 | #253 | Tragic 22.5% |
| Immigrants | Burma/Myanmar | 0.8 /100 | #254 | Tragic 22.6% |
| Immigrants | Sudan | 0.8 /100 | #255 | Tragic 22.6% |
| Immigrants | Belize | 0.8 /100 | #256 | Tragic 22.6% |
| Sudanese | 0.7 /100 | #257 | Tragic 22.6% |
| Bahamians | 0.6 /100 | #258 | Tragic 22.7% |
| Whites/Caucasians | 0.6 /100 | #259 | Tragic 22.7% |
| Celtics | 0.5 /100 | #260 | Tragic 22.7% |
| Immigrants | Cabo Verde | 0.4 /100 | #261 | Tragic 22.8% |
| British West Indians | 0.4 /100 | #262 | Tragic 22.8% |
| Scotch-Irish | 0.3 /100 | #263 | Tragic 22.9% |
| Immigrants | Laos | 0.3 /100 | #264 | Tragic 22.9% |
| Central Americans | 0.2 /100 | #265 | Tragic 23.0% |
| Immigrants | Micronesia | 0.2 /100 | #266 | Tragic 23.0% |
| Senegalese | 0.2 /100 | #267 | Tragic 23.0% |
| Fijians | 0.2 /100 | #268 | Tragic 23.1% |