Cree vs Native/Alaskan Child Poverty Among Girls Under 16

COMPARE

Cree
Race
Ancestry
AfghanAfricanAlaska NativeAlaskan AthabascanAlbanianAleutAlsatianAmericanApacheArabArapahoArgentineanArmenianAssyrian/Chaldean/SyriacAustralianAustrianBahamianBangladeshiBarbadianBasqueBelgianBelizeanBermudanBhutaneseBlackfeetBolivianBrazilianBritishBritish West IndianBulgarianBurmeseCajunCambodianCanadianCape VerdeanCarpatho RusynCelticCentral AmericanCentral American IndianCherokeeCheyenneChickasawChileanChineseChippewaChoctawColombianColvilleComancheCosta RicanCreeCreekCroatianCrowCubanCypriotCzechCzechoslovakianDanishDelawareDominicanDutchDutch West IndianEastern EuropeanEcuadorianEgyptianEnglishEstonianEthiopianEuropeanFijianFilipinoFinnishFrenchFrench American IndianFrench CanadianGermanGerman RussianGhanaianGreekGuamanian/ChamorroGuatemalanGuyaneseHaitianHmongHonduranHopiHoumaHungarianIcelanderIndian (Asian)IndonesianInupiatIranianIraqiIrishIroquoisIsraeliItalianJamaicanJapaneseJordanianKenyanKiowaKoreanLaotianLatvianLebaneseLiberianLithuanianLumbeeLuxembourgerMacedonianMalaysianMalteseMarshalleseMenomineeMexicanMexican American IndianMongolianMoroccanNative HawaiianNavajoNepaleseNew ZealanderNicaraguanNigerianNorthern EuropeanNorwegianOkinawanOsageOttawaPaiutePakistaniPalestinianPanamanianParaguayanPennsylvania GermanPeruvianPimaPolishPortuguesePotawatomiPuebloPuerto RicanPuget Sound SalishRomanianRussianSalvadoranSamoanScandinavianScotch-IrishScottishSeminoleSenegaleseSerbianShoshoneSierra LeoneanSiouxSlavicSlovakSloveneSomaliSouth AfricanSouth AmericanSouth American IndianSoviet UnionSpaniardSpanishSpanish AmericanSpanish American IndianSri LankanSubsaharan AfricanSudaneseSwedishSwissSyrianTaiwaneseThaiTlingit-HaidaTohono O'OdhamTonganTrinidadian and TobagonianTsimshianTurkishU.S. Virgin IslanderUgandanUkrainianUruguayanUteVenezuelanVietnameseWelshWest IndianYakamaYaquiYugoslavianYumanYup'ikZimbabwean
Immigration
NonimmigrantsImmigrantsAfghanistanAfricaAlbaniaArgentinaArmeniaAsiaAustraliaAustriaBahamasBangladeshBarbadosBelarusBelgiumBelizeBoliviaBosnia and HerzegovinaBrazilBulgariaBurma/MyanmarCabo VerdeCambodiaCameroonCanadaCaribbeanCentral AmericaChileChinaColombiaCongoCosta RicaCroatiaCubaCzechoslovakiaDenmarkDominicaDominican RepublicEastern AfricaEastern AsiaEastern EuropeEcuadorEgyptEl SalvadorEnglandEritreaEthiopiaEuropeFijiFranceGermanyGhanaGreeceGrenadaGuatemalaGuyanaHaitiHondurasHong KongHungaryIndiaIndonesiaIranIraqIrelandIsraelItalyJamaicaJapanJordanKazakhstanKenyaKoreaKuwaitLaosLatin AmericaLatviaLebanonLiberiaLithuaniaMalaysiaMexicoMicronesiaMiddle AfricaMoldovaMoroccoNepalNetherlandsNicaraguaNigeriaNorth AmericaNorth MacedoniaNorthern AfricaNorthern EuropeNorwayOceaniaPakistanPanamaPeruPhilippinesPolandPortugalRomaniaRussiaSaudi ArabiaScotlandSenegalSerbiaSierra LeoneSingaporeSomaliaSouth AfricaSouth AmericaSouth Central AsiaSouth Eastern AsiaSouthern EuropeSpainSri LankaSt. Vincent and the GrenadinesSudanSwedenSwitzerlandSyriaTaiwanThailandTrinidad and TobagoTurkeyUgandaUkraineUruguayUzbekistanVenezuelaVietnamWest IndiesWestern AfricaWestern AsiaWestern EuropeYemenZaireZimbabweAzores
Native/Alaskan
Race
Ancestry
AfghanAfricanAlaska NativeAlaskan AthabascanAlbanianAleutAlsatianAmericanApacheArabArapahoArgentineanArmenianAssyrian/Chaldean/SyriacAustralianAustrianBahamianBangladeshiBarbadianBasqueBelgianBelizeanBermudanBhutaneseBlackfeetBolivianBrazilianBritishBritish West IndianBulgarianBurmeseCajunCambodianCanadianCape VerdeanCarpatho RusynCelticCentral AmericanCentral American IndianCherokeeCheyenneChickasawChileanChineseChippewaChoctawColombianColvilleComancheCosta RicanCreekCroatianCrowCubanCypriotCzechCzechoslovakianDanishDelawareDominicanDutchDutch West IndianEastern EuropeanEcuadorianEgyptianEnglishEstonianEthiopianEuropeanFijianFilipinoFinnishFrenchFrench American IndianFrench CanadianGermanGerman RussianGhanaianGreekGuamanian/ChamorroGuatemalanGuyaneseHaitianHmongHonduranHopiHoumaHungarianIcelanderIndian (Asian)IndonesianInupiatIranianIraqiIrishIroquoisIsraeliItalianJamaicanJapaneseJordanianKenyanKiowaKoreanLaotianLatvianLebaneseLiberianLithuanianLumbeeLuxembourgerMacedonianMalaysianMalteseMarshalleseMenomineeMexicanMexican American IndianMongolianMoroccanNative HawaiianNavajoNepaleseNew ZealanderNicaraguanNigerianNorthern EuropeanNorwegianOkinawanOsageOttawaPaiutePakistaniPalestinianPanamanianParaguayanPennsylvania GermanPeruvianPimaPolishPortuguesePotawatomiPuebloPuerto RicanPuget Sound SalishRomanianRussianSalvadoranSamoanScandinavianScotch-IrishScottishSeminoleSenegaleseSerbianShoshoneSierra LeoneanSiouxSlavicSlovakSloveneSomaliSouth AfricanSouth AmericanSouth American IndianSoviet UnionSpaniardSpanishSpanish AmericanSpanish American IndianSri LankanSubsaharan AfricanSudaneseSwedishSwissSyrianTaiwaneseThaiTlingit-HaidaTohono O'OdhamTonganTrinidadian and TobagonianTsimshianTurkishU.S. Virgin IslanderUgandanUkrainianUruguayanUteVenezuelanVietnameseWelshWest IndianYakamaYaquiYugoslavianYumanYup'ikZimbabwean
Immigration
NonimmigrantsImmigrantsAfghanistanAfricaAlbaniaArgentinaArmeniaAsiaAustraliaAustriaBahamasBangladeshBarbadosBelarusBelgiumBelizeBoliviaBosnia and HerzegovinaBrazilBulgariaBurma/MyanmarCabo VerdeCambodiaCameroonCanadaCaribbeanCentral AmericaChileChinaColombiaCongoCosta RicaCroatiaCubaCzechoslovakiaDenmarkDominicaDominican RepublicEastern AfricaEastern AsiaEastern EuropeEcuadorEgyptEl SalvadorEnglandEritreaEthiopiaEuropeFijiFranceGermanyGhanaGreeceGrenadaGuatemalaGuyanaHaitiHondurasHong KongHungaryIndiaIndonesiaIranIraqIrelandIsraelItalyJamaicaJapanJordanKazakhstanKenyaKoreaKuwaitLaosLatin AmericaLatviaLebanonLiberiaLithuaniaMalaysiaMexicoMicronesiaMiddle AfricaMoldovaMoroccoNepalNetherlandsNicaraguaNigeriaNorth AmericaNorth MacedoniaNorthern AfricaNorthern EuropeNorwayOceaniaPakistanPanamaPeruPhilippinesPolandPortugalRomaniaRussiaSaudi ArabiaScotlandSenegalSerbiaSierra LeoneSingaporeSomaliaSouth AfricaSouth AmericaSouth Central AsiaSouth Eastern AsiaSouthern EuropeSpainSri LankaSt. Vincent and the GrenadinesSudanSwedenSwitzerlandSyriaTaiwanThailandTrinidad and TobagoTurkeyUgandaUkraineUruguayUzbekistanVenezuelaVietnamWest IndiesWestern AfricaWestern AsiaWestern EuropeYemenZaireZimbabweAzores
Child Poverty Among Girls Under 16
Income
Poverty
Unemployment
Labor Participation
Family Structure
Vehicle Availability
Education Level
Disability

Child Poverty Among Girls Under 16 Comparison

Cree

Natives/Alaskans

Tragic
Tragic
18.5%
CHILD POVERTY AMONG GIRLS UNDER 16
1.3/ 100
METRIC RATING
231st/ 347
METRIC RANK
24.0%
CHILD POVERTY AMONG GIRLS UNDER 16
0.0/ 100
METRIC RATING
332nd/ 347
METRIC RANK

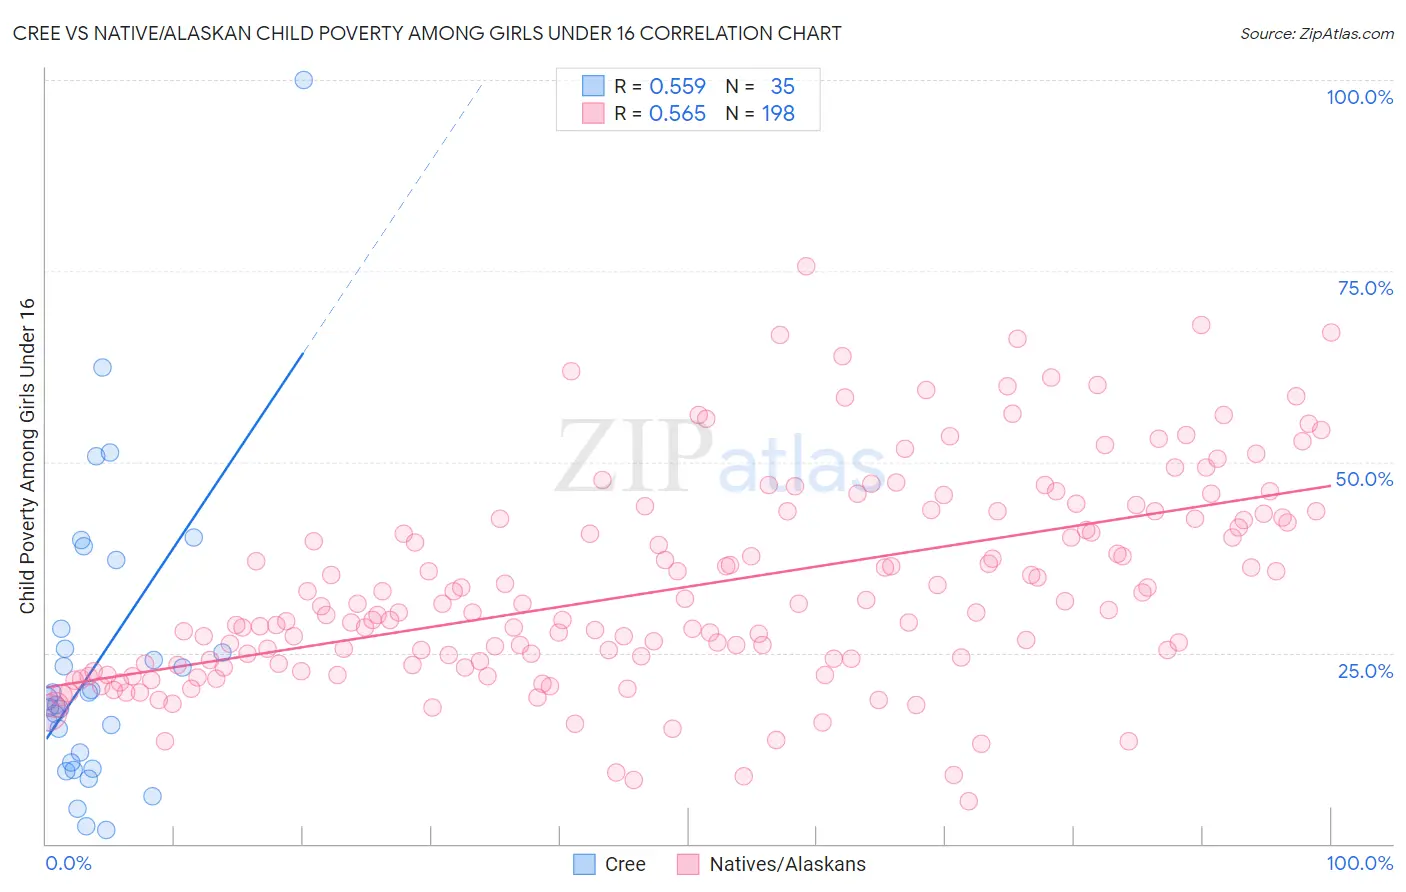
Cree vs Native/Alaskan Child Poverty Among Girls Under 16 Correlation Chart

The statistical analysis conducted on geographies consisting of 75,883,921 people shows a substantial positive correlation between the proportion of Cree and poverty level among girls under the age of 16 in the United States with a correlation coefficient (R) of 0.559 and weighted average of 18.5%. Similarly, the statistical analysis conducted on geographies consisting of 501,562,202 people shows a substantial positive correlation between the proportion of Natives/Alaskans and poverty level among girls under the age of 16 in the United States with a correlation coefficient (R) of 0.565 and weighted average of 24.0%, a difference of 29.7%.
Cree vs Native/Alaskan Child Poverty Among Girls Under 16

Child Poverty Among Girls Under 16 Correlation Summary

MeasurementCreeNative/Alaskan
Minimum1.8%5.5%
Maximum100.0%75.5%
Range98.2%70.0%
Mean24.0%33.7%
Median19.0%30.5%
Interquartile 25% (IQ1)10.7%23.6%
Interquartile 75% (IQ3)28.2%42.8%
Interquartile Range (IQR)17.5%19.2%
Standard Deviation (Sample)19.5%13.6%
Standard Deviation (Population)19.2%13.5%

Similar Demographics by Child Poverty Among Girls Under 16

Demographics Similar to Cree by Child Poverty Among Girls Under 16

In terms of child poverty among girls under 16, the demographic groups most similar to Cree are Osage (18.5%, a difference of 0.080%), Immigrants from Sudan (18.6%, a difference of 0.24%), Ghanaian (18.5%, a difference of 0.27%), Sudanese (18.6%, a difference of 0.28%), and Fijian (18.6%, a difference of 0.35%).
DemographicsRating | RankChild Poverty Among Girls Under 16
Bermudans
2.8
/100
|
#224
Tragic
18.1%
Immigrants | Africa
2.7
/100
|
#225
Tragic
18.2%
Nicaraguans
2.4
/100
|
#226
Tragic
18.2%
Immigrants | Nonimmigrants
2.0
/100
|
#227
Tragic
18.3%
Alaskan Athabascans
2.0
/100
|
#228
Tragic
18.3%
Ghanaians
1.4
/100
|
#229
Tragic
18.5%
Osage
1.3
/100
|
#230
Tragic
18.5%
Cree
1.3
/100
|
#231
Tragic
18.5%
Immigrants | Sudan
1.1
/100
|
#232
Tragic
18.6%
Sudanese
1.1
/100
|
#233
Tragic
18.6%
Fijians
1.1
/100
|
#234
Tragic
18.6%
Nepalese
1.1
/100
|
#235
Tragic
18.6%
Alsatians
1.1
/100
|
#236
Tragic
18.6%
Immigrants | Nigeria
1.0
/100
|
#237
Tragic
18.6%
Immigrants | Eritrea
1.0
/100
|
#238
Tragic
18.7%

Demographics Similar to Natives/Alaskans by Child Poverty Among Girls Under 16

In terms of child poverty among girls under 16, the demographic groups most similar to Natives/Alaskans are Apache (23.8%, a difference of 0.86%), Immigrants from Dominican Republic (23.8%, a difference of 0.91%), Kiowa (23.7%, a difference of 1.5%), Dominican (23.7%, a difference of 1.6%), and Black/African American (24.7%, a difference of 2.5%).
DemographicsRating | RankChild Poverty Among Girls Under 16
Immigrants | Congo
0.0
/100
|
#325
Tragic
22.7%
Immigrants | Honduras
0.0
/100
|
#326
Tragic
22.8%
Central American Indians
0.0
/100
|
#327
Tragic
22.8%
Dominicans
0.0
/100
|
#328
Tragic
23.7%
Kiowa
0.0
/100
|
#329
Tragic
23.7%
Immigrants | Dominican Republic
0.0
/100
|
#330
Tragic
23.8%
Apache
0.0
/100
|
#331
Tragic
23.8%
Natives/Alaskans
0.0
/100
|
#332
Tragic
24.0%
Blacks/African Americans
0.0
/100
|
#333
Tragic
24.7%
Menominee
0.0
/100
|
#334
Tragic
25.0%
Pueblo
0.0
/100
|
#335
Tragic
25.2%
Sioux
0.0
/100
|
#336
Tragic
25.6%
Yup'ik
0.0
/100
|
#337
Tragic
25.8%
Cheyenne
0.0
/100
|
#338
Tragic
26.3%
Crow
0.0
/100
|
#339
Tragic
26.4%