Cree vs Malaysian Child Poverty Among Girls Under 16

COMPARE

Cree
Race
Ancestry
AfghanAfricanAlaska NativeAlaskan AthabascanAlbanianAleutAlsatianAmericanApacheArabArapahoArgentineanArmenianAssyrian/Chaldean/SyriacAustralianAustrianBahamianBangladeshiBarbadianBasqueBelgianBelizeanBermudanBhutaneseBlackfeetBolivianBrazilianBritishBritish West IndianBulgarianBurmeseCajunCambodianCanadianCape VerdeanCarpatho RusynCelticCentral AmericanCentral American IndianCherokeeCheyenneChickasawChileanChineseChippewaChoctawColombianColvilleComancheCosta RicanCreeCreekCroatianCrowCubanCypriotCzechCzechoslovakianDanishDelawareDominicanDutchDutch West IndianEastern EuropeanEcuadorianEgyptianEnglishEstonianEthiopianEuropeanFijianFilipinoFinnishFrenchFrench American IndianFrench CanadianGermanGerman RussianGhanaianGreekGuamanian/ChamorroGuatemalanGuyaneseHaitianHmongHonduranHopiHoumaHungarianIcelanderIndian (Asian)IndonesianInupiatIranianIraqiIrishIroquoisIsraeliItalianJamaicanJapaneseJordanianKenyanKiowaKoreanLaotianLatvianLebaneseLiberianLithuanianLumbeeLuxembourgerMacedonianMalteseMarshalleseMenomineeMexicanMexican American IndianMongolianMoroccanNative HawaiianNavajoNepaleseNew ZealanderNicaraguanNigerianNorthern EuropeanNorwegianOkinawanOsageOttawaPaiutePakistaniPalestinianPanamanianParaguayanPennsylvania GermanPeruvianPimaPolishPortuguesePotawatomiPuebloPuerto RicanPuget Sound SalishRomanianRussianSalvadoranSamoanScandinavianScotch-IrishScottishSeminoleSenegaleseSerbianShoshoneSierra LeoneanSiouxSlavicSlovakSloveneSomaliSouth AfricanSouth AmericanSouth American IndianSoviet UnionSpaniardSpanishSpanish AmericanSpanish American IndianSri LankanSubsaharan AfricanSudaneseSwedishSwissSyrianTaiwaneseThaiTlingit-HaidaTohono O'OdhamTonganTrinidadian and TobagonianTsimshianTurkishU.S. Virgin IslanderUgandanUkrainianUruguayanUteVenezuelanVietnameseWelshWest IndianYakamaYaquiYugoslavianYumanYup'ikZimbabwean
Immigration
NonimmigrantsImmigrantsAfghanistanAfricaAlbaniaArgentinaArmeniaAsiaAustraliaAustriaBahamasBangladeshBarbadosBelarusBelgiumBelizeBoliviaBosnia and HerzegovinaBrazilBulgariaBurma/MyanmarCabo VerdeCambodiaCameroonCanadaCaribbeanCentral AmericaChileChinaColombiaCongoCosta RicaCroatiaCubaCzechoslovakiaDenmarkDominicaDominican RepublicEastern AfricaEastern AsiaEastern EuropeEcuadorEgyptEl SalvadorEnglandEritreaEthiopiaEuropeFijiFranceGermanyGhanaGreeceGrenadaGuatemalaGuyanaHaitiHondurasHong KongHungaryIndiaIndonesiaIranIraqIrelandIsraelItalyJamaicaJapanJordanKazakhstanKenyaKoreaKuwaitLaosLatin AmericaLatviaLebanonLiberiaLithuaniaMalaysiaMexicoMicronesiaMiddle AfricaMoldovaMoroccoNepalNetherlandsNicaraguaNigeriaNorth AmericaNorth MacedoniaNorthern AfricaNorthern EuropeNorwayOceaniaPakistanPanamaPeruPhilippinesPolandPortugalRomaniaRussiaSaudi ArabiaScotlandSenegalSerbiaSierra LeoneSingaporeSomaliaSouth AfricaSouth AmericaSouth Central AsiaSouth Eastern AsiaSouthern EuropeSpainSri LankaSt. Vincent and the GrenadinesSudanSwedenSwitzerlandSyriaTaiwanThailandTrinidad and TobagoTurkeyUgandaUkraineUruguayUzbekistanVenezuelaVietnamWest IndiesWestern AfricaWestern AsiaWestern EuropeYemenZaireZimbabweAzores
Malaysian
Race
Ancestry
AfghanAfricanAlaska NativeAlaskan AthabascanAlbanianAleutAlsatianAmericanApacheArabArapahoArgentineanArmenianAssyrian/Chaldean/SyriacAustralianAustrianBahamianBangladeshiBarbadianBasqueBelgianBelizeanBermudanBhutaneseBlackfeetBolivianBrazilianBritishBritish West IndianBulgarianBurmeseCajunCambodianCanadianCape VerdeanCarpatho RusynCelticCentral AmericanCentral American IndianCherokeeCheyenneChickasawChileanChineseChippewaChoctawColombianColvilleComancheCosta RicanCreekCroatianCrowCubanCypriotCzechCzechoslovakianDanishDelawareDominicanDutchDutch West IndianEastern EuropeanEcuadorianEgyptianEnglishEstonianEthiopianEuropeanFijianFilipinoFinnishFrenchFrench American IndianFrench CanadianGermanGerman RussianGhanaianGreekGuamanian/ChamorroGuatemalanGuyaneseHaitianHmongHonduranHopiHoumaHungarianIcelanderIndian (Asian)IndonesianInupiatIranianIraqiIrishIroquoisIsraeliItalianJamaicanJapaneseJordanianKenyanKiowaKoreanLaotianLatvianLebaneseLiberianLithuanianLumbeeLuxembourgerMacedonianMalaysianMalteseMarshalleseMenomineeMexicanMexican American IndianMongolianMoroccanNative HawaiianNavajoNepaleseNew ZealanderNicaraguanNigerianNorthern EuropeanNorwegianOkinawanOsageOttawaPaiutePakistaniPalestinianPanamanianParaguayanPennsylvania GermanPeruvianPimaPolishPortuguesePotawatomiPuebloPuerto RicanPuget Sound SalishRomanianRussianSalvadoranSamoanScandinavianScotch-IrishScottishSeminoleSenegaleseSerbianShoshoneSierra LeoneanSiouxSlavicSlovakSloveneSomaliSouth AfricanSouth AmericanSouth American IndianSoviet UnionSpaniardSpanishSpanish AmericanSpanish American IndianSri LankanSubsaharan AfricanSudaneseSwedishSwissSyrianTaiwaneseThaiTlingit-HaidaTohono O'OdhamTonganTrinidadian and TobagonianTsimshianTurkishU.S. Virgin IslanderUgandanUkrainianUruguayanUteVenezuelanVietnameseWelshWest IndianYakamaYaquiYugoslavianYumanYup'ikZimbabwean
Immigration
NonimmigrantsImmigrantsAfghanistanAfricaAlbaniaArgentinaArmeniaAsiaAustraliaAustriaBahamasBangladeshBarbadosBelarusBelgiumBelizeBoliviaBosnia and HerzegovinaBrazilBulgariaBurma/MyanmarCabo VerdeCambodiaCameroonCanadaCaribbeanCentral AmericaChileChinaColombiaCongoCosta RicaCroatiaCubaCzechoslovakiaDenmarkDominicaDominican RepublicEastern AfricaEastern AsiaEastern EuropeEcuadorEgyptEl SalvadorEnglandEritreaEthiopiaEuropeFijiFranceGermanyGhanaGreeceGrenadaGuatemalaGuyanaHaitiHondurasHong KongHungaryIndiaIndonesiaIranIraqIrelandIsraelItalyJamaicaJapanJordanKazakhstanKenyaKoreaKuwaitLaosLatin AmericaLatviaLebanonLiberiaLithuaniaMalaysiaMexicoMicronesiaMiddle AfricaMoldovaMoroccoNepalNetherlandsNicaraguaNigeriaNorth AmericaNorth MacedoniaNorthern AfricaNorthern EuropeNorwayOceaniaPakistanPanamaPeruPhilippinesPolandPortugalRomaniaRussiaSaudi ArabiaScotlandSenegalSerbiaSierra LeoneSingaporeSomaliaSouth AfricaSouth AmericaSouth Central AsiaSouth Eastern AsiaSouthern EuropeSpainSri LankaSt. Vincent and the GrenadinesSudanSwedenSwitzerlandSyriaTaiwanThailandTrinidad and TobagoTurkeyUgandaUkraineUruguayUzbekistanVenezuelaVietnamWest IndiesWestern AfricaWestern AsiaWestern EuropeYemenZaireZimbabweAzores
Child Poverty Among Girls Under 16
Income
Poverty
Unemployment
Labor Participation
Family Structure
Vehicle Availability
Education Level
Disability

Child Poverty Among Girls Under 16 Comparison

Cree

Malaysians

Tragic
Tragic
18.5%
CHILD POVERTY AMONG GIRLS UNDER 16
1.3/ 100
METRIC RATING
231st/ 347
METRIC RANK
17.8%
CHILD POVERTY AMONG GIRLS UNDER 16
5.7/ 100
METRIC RATING
214th/ 347
METRIC RANK

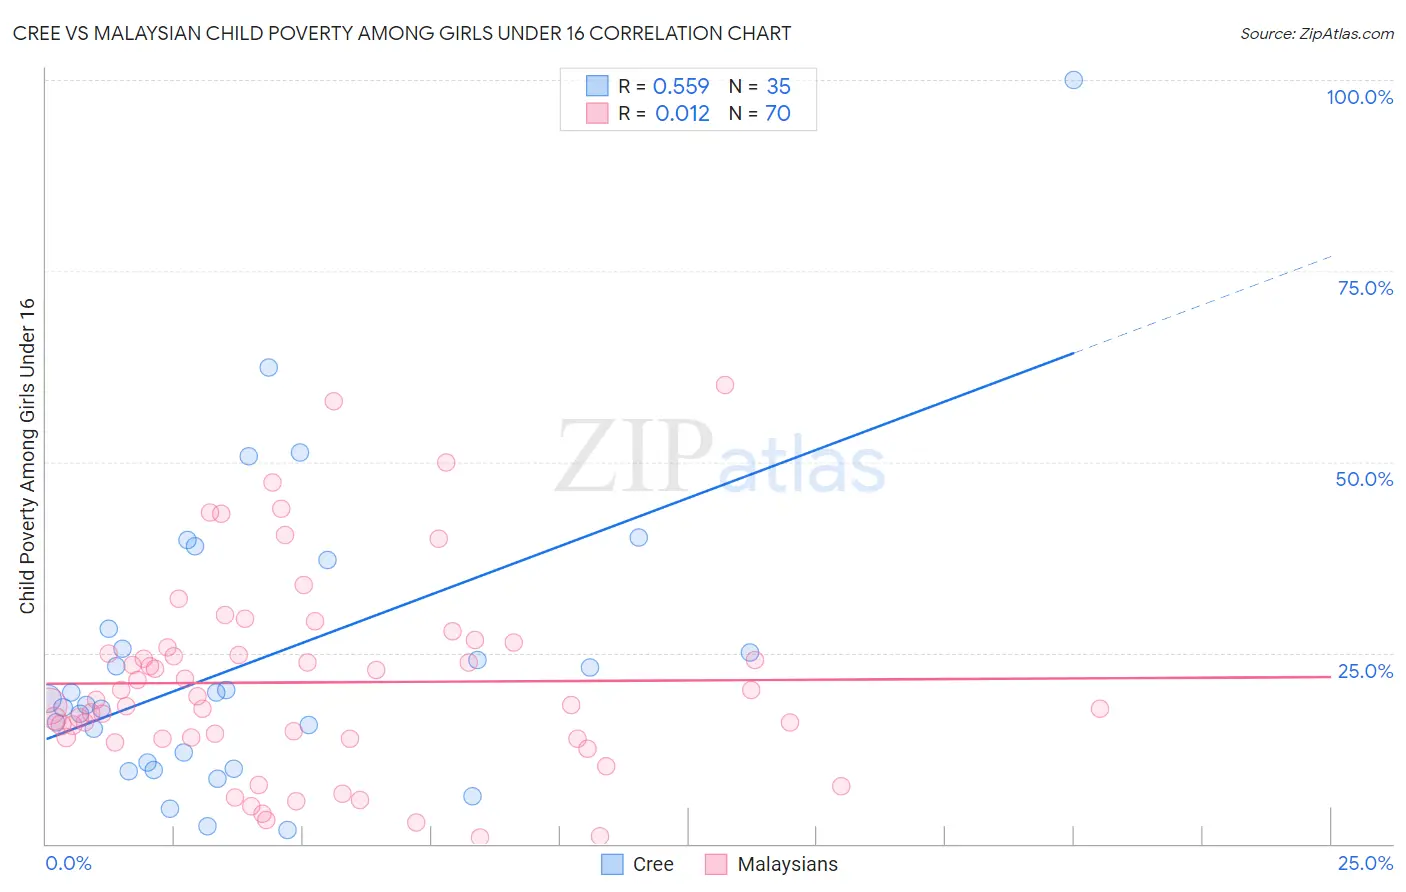
Cree vs Malaysian Child Poverty Among Girls Under 16 Correlation Chart

The statistical analysis conducted on geographies consisting of 75,883,921 people shows a substantial positive correlation between the proportion of Cree and poverty level among girls under the age of 16 in the United States with a correlation coefficient (R) of 0.559 and weighted average of 18.5%. Similarly, the statistical analysis conducted on geographies consisting of 224,243,890 people shows no correlation between the proportion of Malaysians and poverty level among girls under the age of 16 in the United States with a correlation coefficient (R) of 0.012 and weighted average of 17.8%, a difference of 4.2%.
Cree vs Malaysian Child Poverty Among Girls Under 16

Child Poverty Among Girls Under 16 Correlation Summary

MeasurementCreeMalaysian
Minimum1.8%0.81%
Maximum100.0%60.0%
Range98.2%59.2%
Mean24.0%21.1%
Median19.0%18.5%
Interquartile 25% (IQ1)10.7%13.8%
Interquartile 75% (IQ3)28.2%25.6%
Interquartile Range (IQR)17.5%11.8%
Standard Deviation (Sample)19.5%12.9%
Standard Deviation (Population)19.2%12.8%

Demographics Similar to Cree and Malaysians by Child Poverty Among Girls Under 16

In terms of child poverty among girls under 16, the demographic groups most similar to Cree are Osage (18.5%, a difference of 0.080%), Immigrants from Sudan (18.6%, a difference of 0.24%), Ghanaian (18.5%, a difference of 0.27%), Alaskan Athabascan (18.3%, a difference of 1.2%), and Nonimmigrants (18.3%, a difference of 1.2%). Similarly, the demographic groups most similar to Malaysians are German Russian (17.8%, a difference of 0.0%), Pennsylvania German (17.8%, a difference of 0.020%), Moroccan (17.8%, a difference of 0.10%), Japanese (17.8%, a difference of 0.19%), and Immigrants from Thailand (17.7%, a difference of 0.28%).
DemographicsRating | RankChild Poverty Among Girls Under 16
Immigrants | Thailand
6.3
/100
|
#212
Tragic
17.7%
Pennsylvania Germans
5.7
/100
|
#213
Tragic
17.8%
Malaysians
5.7
/100
|
#214
Tragic
17.8%
German Russians
5.7
/100
|
#215
Tragic
17.8%
Moroccans
5.5
/100
|
#216
Tragic
17.8%
Japanese
5.3
/100
|
#217
Tragic
17.8%
Alaska Natives
5.2
/100
|
#218
Tragic
17.8%
Immigrants | Panama
4.7
/100
|
#219
Tragic
17.9%
Cubans
4.1
/100
|
#220
Tragic
18.0%
Immigrants | Micronesia
3.5
/100
|
#221
Tragic
18.0%
Immigrants | Cambodia
2.9
/100
|
#222
Tragic
18.1%
Immigrants | Armenia
2.9
/100
|
#223
Tragic
18.1%
Bermudans
2.8
/100
|
#224
Tragic
18.1%
Immigrants | Africa
2.7
/100
|
#225
Tragic
18.2%
Nicaraguans
2.4
/100
|
#226
Tragic
18.2%
Immigrants | Nonimmigrants
2.0
/100
|
#227
Tragic
18.3%
Alaskan Athabascans
2.0
/100
|
#228
Tragic
18.3%
Ghanaians
1.4
/100
|
#229
Tragic
18.5%
Osage
1.3
/100
|
#230
Tragic
18.5%
Cree
1.3
/100
|
#231
Tragic
18.5%
Immigrants | Sudan
1.1
/100
|
#232
Tragic
18.6%