Cherokee vs Taiwanese Single Father Poverty
COMPARE
Cherokee
Taiwanese
Single Father Poverty
Single Father Poverty Comparison
Cherokee
Taiwanese
19.6%
SINGLE FATHER POVERTY
0.0/ 100
METRIC RATING
321st/ 347
METRIC RANK
14.3%
SINGLE FATHER POVERTY
100.0/ 100
METRIC RATING
22nd/ 347
METRIC RANK
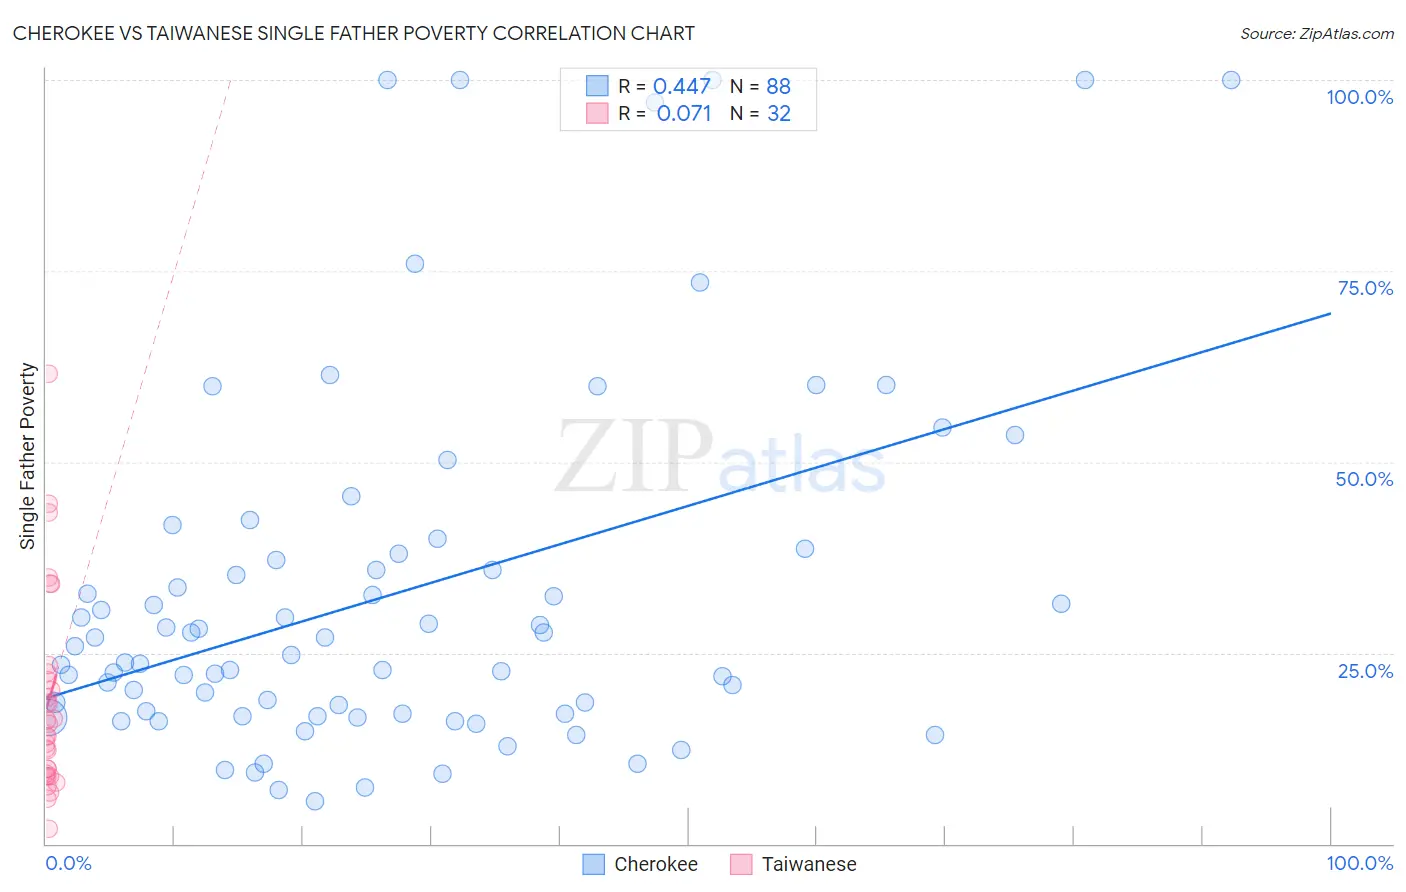
Cherokee vs Taiwanese Single Father Poverty Correlation Chart
The statistical analysis conducted on geographies consisting of 376,598,860 people shows a moderate positive correlation between the proportion of Cherokee and poverty level among single fathers in the United States with a correlation coefficient (R) of 0.447 and weighted average of 19.6%. Similarly, the statistical analysis conducted on geographies consisting of 30,651,469 people shows a slight positive correlation between the proportion of Taiwanese and poverty level among single fathers in the United States with a correlation coefficient (R) of 0.071 and weighted average of 14.3%, a difference of 37.1%.
Single Father Poverty Correlation Summary
| Measurement | Cherokee | Taiwanese |
| Minimum | 5.6% | 2.0% |
| Maximum | 100.0% | 61.5% |
| Range | 94.4% | 59.5% |
| Mean | 32.7% | 18.6% |
| Median | 25.3% | 14.9% |
| Interquartile 25% (IQ1) | 17.1% | 9.0% |
| Interquartile 75% (IQ3) | 37.5% | 21.9% |
| Interquartile Range (IQR) | 20.4% | 12.9% |
| Standard Deviation (Sample) | 23.5% | 13.2% |
| Standard Deviation (Population) | 23.4% | 13.0% |
Similar Demographics by Single Father Poverty
Demographics Similar to Cherokee by Single Father Poverty
In terms of single father poverty, the demographic groups most similar to Cherokee are Inupiat (19.5%, a difference of 0.85%), Creek (19.8%, a difference of 1.0%), Slovak (19.3%, a difference of 1.8%), Pennsylvania German (20.0%, a difference of 1.9%), and American (20.1%, a difference of 2.1%).
| Demographics | Rating | Rank | Single Father Poverty |
| Delaware | 0.0 /100 | #314 | Tragic 18.9% |
| Chickasaw | 0.0 /100 | #315 | Tragic 19.0% |
| Osage | 0.0 /100 | #316 | Tragic 19.0% |
| Dominicans | 0.0 /100 | #317 | Tragic 19.1% |
| Dutch West Indians | 0.0 /100 | #318 | Tragic 19.2% |
| Slovaks | 0.0 /100 | #319 | Tragic 19.3% |
| Inupiat | 0.0 /100 | #320 | Tragic 19.5% |
| Cherokee | 0.0 /100 | #321 | Tragic 19.6% |
| Creek | 0.0 /100 | #322 | Tragic 19.8% |
| Pennsylvania Germans | 0.0 /100 | #323 | Tragic 20.0% |
| Americans | 0.0 /100 | #324 | Tragic 20.1% |
| Blacks/African Americans | 0.0 /100 | #325 | Tragic 20.4% |
| Immigrants | Yemen | 0.0 /100 | #326 | Tragic 20.6% |
| Choctaw | 0.0 /100 | #327 | Tragic 20.7% |
| Pueblo | 0.0 /100 | #328 | Tragic 21.1% |
Demographics Similar to Taiwanese by Single Father Poverty
In terms of single father poverty, the demographic groups most similar to Taiwanese are Immigrants from Egypt (14.4%, a difference of 0.21%), Immigrants from South Eastern Asia (14.4%, a difference of 0.21%), Iranian (14.4%, a difference of 0.25%), Immigrants from Afghanistan (14.3%, a difference of 0.33%), and Immigrants from Singapore (14.3%, a difference of 0.43%).
| Demographics | Rating | Rank | Single Father Poverty |
| Sri Lankans | 100.0 /100 | #15 | Exceptional 14.2% |
| Immigrants | Iran | 100.0 /100 | #16 | Exceptional 14.2% |
| Immigrants | Hong Kong | 100.0 /100 | #17 | Exceptional 14.2% |
| Soviet Union | 100.0 /100 | #18 | Exceptional 14.3% |
| Immigrants | Iraq | 100.0 /100 | #19 | Exceptional 14.3% |
| Immigrants | Singapore | 100.0 /100 | #20 | Exceptional 14.3% |
| Immigrants | Afghanistan | 100.0 /100 | #21 | Exceptional 14.3% |
| Taiwanese | 100.0 /100 | #22 | Exceptional 14.3% |
| Immigrants | Egypt | 100.0 /100 | #23 | Exceptional 14.4% |
| Immigrants | South Eastern Asia | 100.0 /100 | #24 | Exceptional 14.4% |
| Iranians | 100.0 /100 | #25 | Exceptional 14.4% |
| Spanish American Indians | 100.0 /100 | #26 | Exceptional 14.4% |
| Nepalese | 100.0 /100 | #27 | Exceptional 14.4% |
| Immigrants | South Central Asia | 100.0 /100 | #28 | Exceptional 14.5% |
| Somalis | 100.0 /100 | #29 | Exceptional 14.5% |