Cherokee vs Taiwanese 6th Grade

COMPARE

Cherokee
Race
Ancestry
AfghanAfricanAlaska NativeAlaskan AthabascanAlbanianAleutAlsatianAmericanApacheArabArapahoArgentineanArmenianAssyrian/Chaldean/SyriacAustralianAustrianBahamianBangladeshiBarbadianBasqueBelgianBelizeanBermudanBhutaneseBlackfeetBolivianBrazilianBritishBritish West IndianBulgarianBurmeseCajunCambodianCanadianCape VerdeanCarpatho RusynCelticCentral AmericanCentral American IndianCherokeeCheyenneChickasawChileanChineseChippewaChoctawColombianColvilleComancheCosta RicanCreeCreekCroatianCrowCubanCypriotCzechCzechoslovakianDanishDelawareDominicanDutchDutch West IndianEastern EuropeanEcuadorianEgyptianEnglishEstonianEthiopianEuropeanFijianFilipinoFinnishFrenchFrench American IndianFrench CanadianGermanGerman RussianGhanaianGreekGuamanian/ChamorroGuatemalanGuyaneseHaitianHmongHonduranHopiHoumaHungarianIcelanderIndian (Asian)IndonesianInupiatIranianIraqiIrishIroquoisIsraeliItalianJamaicanJapaneseJordanianKenyanKiowaKoreanLaotianLatvianLebaneseLiberianLithuanianLumbeeLuxembourgerMacedonianMalaysianMalteseMarshalleseMenomineeMexicanMexican American IndianMongolianMoroccanNative HawaiianNavajoNepaleseNew ZealanderNicaraguanNigerianNorthern EuropeanNorwegianOkinawanOsageOttawaPaiutePakistaniPalestinianPanamanianParaguayanPennsylvania GermanPeruvianPimaPolishPortuguesePotawatomiPuebloPuerto RicanPuget Sound SalishRomanianRussianSalvadoranSamoanScandinavianScotch-IrishScottishSeminoleSenegaleseSerbianShoshoneSierra LeoneanSiouxSlavicSlovakSloveneSomaliSouth AfricanSouth AmericanSouth American IndianSoviet UnionSpaniardSpanishSpanish AmericanSpanish American IndianSri LankanSubsaharan AfricanSudaneseSwedishSwissSyrianThaiTlingit-HaidaTohono O'OdhamTonganTrinidadian and TobagonianTsimshianTurkishU.S. Virgin IslanderUgandanUkrainianUruguayanUteVenezuelanVietnameseWelshWest IndianYakamaYaquiYugoslavianYumanYup'ikZimbabwean
Immigration
NonimmigrantsImmigrantsAfghanistanAfricaAlbaniaArgentinaArmeniaAsiaAustraliaAustriaBahamasBangladeshBarbadosBelarusBelgiumBelizeBoliviaBosnia and HerzegovinaBrazilBulgariaBurma/MyanmarCabo VerdeCambodiaCameroonCanadaCaribbeanCentral AmericaChileChinaColombiaCongoCosta RicaCroatiaCubaCzechoslovakiaDenmarkDominicaDominican RepublicEastern AfricaEastern AsiaEastern EuropeEcuadorEgyptEl SalvadorEnglandEritreaEthiopiaEuropeFijiFranceGermanyGhanaGreeceGrenadaGuatemalaGuyanaHaitiHondurasHong KongHungaryIndiaIndonesiaIranIraqIrelandIsraelItalyJamaicaJapanJordanKazakhstanKenyaKoreaKuwaitLaosLatin AmericaLatviaLebanonLiberiaLithuaniaMalaysiaMexicoMicronesiaMiddle AfricaMoldovaMoroccoNepalNetherlandsNicaraguaNigeriaNorth AmericaNorth MacedoniaNorthern AfricaNorthern EuropeNorwayOceaniaPakistanPanamaPeruPhilippinesPolandPortugalRomaniaRussiaSaudi ArabiaScotlandSenegalSerbiaSierra LeoneSingaporeSomaliaSouth AfricaSouth AmericaSouth Central AsiaSouth Eastern AsiaSouthern EuropeSpainSri LankaSt. Vincent and the GrenadinesSudanSwedenSwitzerlandSyriaTaiwanThailandTrinidad and TobagoTurkeyUgandaUkraineUruguayUzbekistanVenezuelaVietnamWest IndiesWestern AfricaWestern AsiaWestern EuropeYemenZaireZimbabweAzores
Taiwanese
Race
Ancestry
AfghanAfricanAlaska NativeAlaskan AthabascanAlbanianAleutAlsatianAmericanApacheArabArapahoArgentineanArmenianAssyrian/Chaldean/SyriacAustralianAustrianBahamianBangladeshiBarbadianBasqueBelgianBelizeanBermudanBhutaneseBlackfeetBolivianBrazilianBritishBritish West IndianBulgarianBurmeseCajunCambodianCanadianCape VerdeanCarpatho RusynCelticCentral AmericanCentral American IndianCheyenneChickasawChileanChineseChippewaChoctawColombianColvilleComancheCosta RicanCreeCreekCroatianCrowCubanCypriotCzechCzechoslovakianDanishDelawareDominicanDutchDutch West IndianEastern EuropeanEcuadorianEgyptianEnglishEstonianEthiopianEuropeanFijianFilipinoFinnishFrenchFrench American IndianFrench CanadianGermanGerman RussianGhanaianGreekGuamanian/ChamorroGuatemalanGuyaneseHaitianHmongHonduranHopiHoumaHungarianIcelanderIndian (Asian)IndonesianInupiatIranianIraqiIrishIroquoisIsraeliItalianJamaicanJapaneseJordanianKenyanKiowaKoreanLaotianLatvianLebaneseLiberianLithuanianLumbeeLuxembourgerMacedonianMalaysianMalteseMarshalleseMenomineeMexicanMexican American IndianMongolianMoroccanNative HawaiianNavajoNepaleseNew ZealanderNicaraguanNigerianNorthern EuropeanNorwegianOkinawanOsageOttawaPaiutePakistaniPalestinianPanamanianParaguayanPennsylvania GermanPeruvianPimaPolishPortuguesePotawatomiPuebloPuerto RicanPuget Sound SalishRomanianRussianSalvadoranSamoanScandinavianScotch-IrishScottishSeminoleSenegaleseSerbianShoshoneSierra LeoneanSiouxSlavicSlovakSloveneSomaliSouth AfricanSouth AmericanSouth American IndianSoviet UnionSpaniardSpanishSpanish AmericanSpanish American IndianSri LankanSubsaharan AfricanSudaneseSwedishSwissSyrianTaiwaneseThaiTlingit-HaidaTohono O'OdhamTonganTrinidadian and TobagonianTsimshianTurkishU.S. Virgin IslanderUgandanUkrainianUruguayanUteVenezuelanVietnameseWelshWest IndianYakamaYaquiYugoslavianYumanYup'ikZimbabwean
Immigration
NonimmigrantsImmigrantsAfghanistanAfricaAlbaniaArgentinaArmeniaAsiaAustraliaAustriaBahamasBangladeshBarbadosBelarusBelgiumBelizeBoliviaBosnia and HerzegovinaBrazilBulgariaBurma/MyanmarCabo VerdeCambodiaCameroonCanadaCaribbeanCentral AmericaChileChinaColombiaCongoCosta RicaCroatiaCubaCzechoslovakiaDenmarkDominicaDominican RepublicEastern AfricaEastern AsiaEastern EuropeEcuadorEgyptEl SalvadorEnglandEritreaEthiopiaEuropeFijiFranceGermanyGhanaGreeceGrenadaGuatemalaGuyanaHaitiHondurasHong KongHungaryIndiaIndonesiaIranIraqIrelandIsraelItalyJamaicaJapanJordanKazakhstanKenyaKoreaKuwaitLaosLatin AmericaLatviaLebanonLiberiaLithuaniaMalaysiaMexicoMicronesiaMiddle AfricaMoldovaMoroccoNepalNetherlandsNicaraguaNigeriaNorth AmericaNorth MacedoniaNorthern AfricaNorthern EuropeNorwayOceaniaPakistanPanamaPeruPhilippinesPolandPortugalRomaniaRussiaSaudi ArabiaScotlandSenegalSerbiaSierra LeoneSingaporeSomaliaSouth AfricaSouth AmericaSouth Central AsiaSouth Eastern AsiaSouthern EuropeSpainSri LankaSt. Vincent and the GrenadinesSudanSwedenSwitzerlandSyriaTaiwanThailandTrinidad and TobagoTurkeyUgandaUkraineUruguayUzbekistanVenezuelaVietnamWest IndiesWestern AfricaWestern AsiaWestern EuropeYemenZaireZimbabweAzores
6th Grade
Income
Poverty
Unemployment
Labor Participation
Family Structure
Vehicle Availability
Education Level
Disability

6th Grade Comparison

Cherokee

Taiwanese

Exceptional
Tragic
97.6%
6TH GRADE
99.4/ 100
METRIC RATING
73rd/ 347
METRIC RANK
96.5%
6TH GRADE
0.5/ 100
METRIC RATING
257th/ 347
METRIC RANK

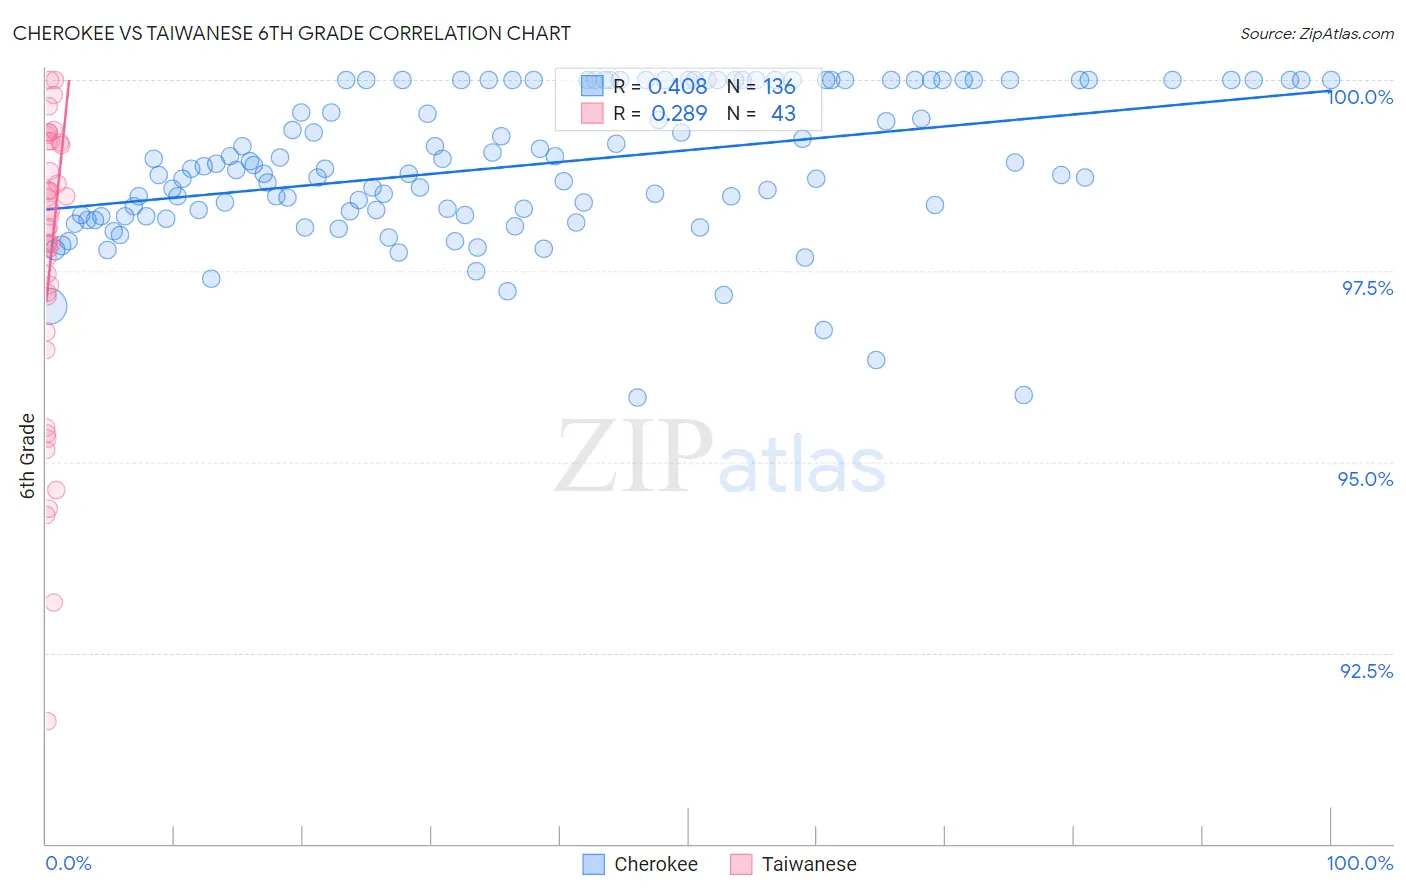
Cherokee vs Taiwanese 6th Grade Correlation Chart

The statistical analysis conducted on geographies consisting of 493,717,288 people shows a moderate positive correlation between the proportion of Cherokee and percentage of population with at least 6th grade education in the United States with a correlation coefficient (R) of 0.408 and weighted average of 97.6%. Similarly, the statistical analysis conducted on geographies consisting of 31,677,387 people shows a weak positive correlation between the proportion of Taiwanese and percentage of population with at least 6th grade education in the United States with a correlation coefficient (R) of 0.289 and weighted average of 96.5%, a difference of 1.2%.
Cherokee vs Taiwanese 6th Grade

6th Grade Correlation Summary

MeasurementCherokeeTaiwanese
Minimum95.8%91.6%
Maximum100.0%100.0%
Range4.2%8.4%
Mean98.9%97.6%
Median98.8%98.1%
Interquartile 25% (IQ1)98.2%96.7%
Interquartile 75% (IQ3)100.0%99.2%
Interquartile Range (IQR)1.8%2.5%
Standard Deviation (Sample)0.95%2.0%
Standard Deviation (Population)0.95%1.9%

Similar Demographics by 6th Grade

Demographics Similar to Cherokee by 6th Grade

In terms of 6th grade, the demographic groups most similar to Cherokee are Macedonian (97.6%, a difference of 0.0%), Chickasaw (97.6%, a difference of 0.010%), Immigrants from Netherlands (97.6%, a difference of 0.010%), Ukrainian (97.6%, a difference of 0.010%), and Immigrants from England (97.6%, a difference of 0.010%).
DemographicsRating | Rank6th Grade
New Zealanders
99.6
/100
|
#66
Exceptional
97.7%
Kiowa
99.6
/100
|
#67
Exceptional
97.7%
Immigrants | Austria
99.6
/100
|
#68
Exceptional
97.7%
Iranians
99.6
/100
|
#69
Exceptional
97.6%
Cajuns
99.5
/100
|
#70
Exceptional
97.6%
Chickasaw
99.5
/100
|
#71
Exceptional
97.6%
Macedonians
99.4
/100
|
#72
Exceptional
97.6%
Cherokee
99.4
/100
|
#73
Exceptional
97.6%
Immigrants | Netherlands
99.4
/100
|
#74
Exceptional
97.6%
Ukrainians
99.4
/100
|
#75
Exceptional
97.6%
Immigrants | England
99.4
/100
|
#76
Exceptional
97.6%
Immigrants | Lithuania
99.3
/100
|
#77
Exceptional
97.6%
Icelanders
99.3
/100
|
#78
Exceptional
97.6%
Immigrants | India
99.3
/100
|
#79
Exceptional
97.6%
Osage
99.3
/100
|
#80
Exceptional
97.6%

Demographics Similar to Taiwanese by 6th Grade

In terms of 6th grade, the demographic groups most similar to Taiwanese are Immigrants from China (96.4%, a difference of 0.010%), Immigrants from Ethiopia (96.5%, a difference of 0.020%), Immigrants from Congo (96.5%, a difference of 0.020%), U.S. Virgin Islander (96.5%, a difference of 0.020%), and South American (96.4%, a difference of 0.020%).
DemographicsRating | Rank6th Grade
Immigrants | Middle Africa
0.8
/100
|
#250
Tragic
96.5%
Immigrants | Senegal
0.7
/100
|
#251
Tragic
96.5%
Immigrants | Uruguay
0.6
/100
|
#252
Tragic
96.5%
Jamaicans
0.6
/100
|
#253
Tragic
96.5%
Immigrants | Ethiopia
0.6
/100
|
#254
Tragic
96.5%
Immigrants | Congo
0.6
/100
|
#255
Tragic
96.5%
U.S. Virgin Islanders
0.5
/100
|
#256
Tragic
96.5%
Taiwanese
0.5
/100
|
#257
Tragic
96.5%
Immigrants | China
0.4
/100
|
#258
Tragic
96.4%
South Americans
0.4
/100
|
#259
Tragic
96.4%
Peruvians
0.4
/100
|
#260
Tragic
96.4%
Immigrants | Sierra Leone
0.4
/100
|
#261
Tragic
96.4%
Immigrants | Nigeria
0.3
/100
|
#262
Tragic
96.4%
Immigrants | Colombia
0.3
/100
|
#263
Tragic
96.4%
Armenians
0.3
/100
|
#264
Tragic
96.4%