Cherokee vs Immigrants from Mexico Single Father Poverty

COMPARE

Cherokee
Race
Ancestry
AfghanAfricanAlaska NativeAlaskan AthabascanAlbanianAleutAlsatianAmericanApacheArabArapahoArgentineanArmenianAssyrian/Chaldean/SyriacAustralianAustrianBahamianBangladeshiBarbadianBasqueBelgianBelizeanBermudanBhutaneseBlackfeetBolivianBrazilianBritishBritish West IndianBulgarianBurmeseCajunCambodianCanadianCape VerdeanCarpatho RusynCelticCentral AmericanCentral American IndianCherokeeCheyenneChickasawChileanChineseChippewaChoctawColombianColvilleComancheCosta RicanCreeCreekCroatianCrowCubanCypriotCzechCzechoslovakianDanishDelawareDominicanDutchDutch West IndianEastern EuropeanEcuadorianEgyptianEnglishEstonianEthiopianEuropeanFijianFilipinoFinnishFrenchFrench American IndianFrench CanadianGermanGerman RussianGhanaianGreekGuamanian/ChamorroGuatemalanGuyaneseHaitianHmongHonduranHopiHoumaHungarianIcelanderIndian (Asian)IndonesianInupiatIranianIraqiIrishIroquoisIsraeliItalianJamaicanJapaneseJordanianKenyanKiowaKoreanLaotianLatvianLebaneseLiberianLithuanianLumbeeLuxembourgerMacedonianMalaysianMalteseMarshalleseMenomineeMexicanMexican American IndianMongolianMoroccanNative HawaiianNavajoNepaleseNew ZealanderNicaraguanNigerianNorthern EuropeanNorwegianOkinawanOsageOttawaPaiutePakistaniPalestinianPanamanianParaguayanPennsylvania GermanPeruvianPimaPolishPortuguesePotawatomiPuebloPuerto RicanPuget Sound SalishRomanianRussianSalvadoranSamoanScandinavianScotch-IrishScottishSeminoleSenegaleseSerbianShoshoneSierra LeoneanSiouxSlavicSlovakSloveneSomaliSouth AfricanSouth AmericanSouth American IndianSoviet UnionSpaniardSpanishSpanish AmericanSpanish American IndianSri LankanSubsaharan AfricanSudaneseSwedishSwissSyrianTaiwaneseThaiTlingit-HaidaTohono O'OdhamTonganTrinidadian and TobagonianTsimshianTurkishU.S. Virgin IslanderUgandanUkrainianUruguayanUteVenezuelanVietnameseWelshWest IndianYakamaYaquiYugoslavianYumanYup'ikZimbabwean
Immigration
NonimmigrantsImmigrantsAfghanistanAfricaAlbaniaArgentinaArmeniaAsiaAustraliaAustriaBahamasBangladeshBarbadosBelarusBelgiumBelizeBoliviaBosnia and HerzegovinaBrazilBulgariaBurma/MyanmarCabo VerdeCambodiaCameroonCanadaCaribbeanCentral AmericaChileChinaColombiaCongoCosta RicaCroatiaCubaCzechoslovakiaDenmarkDominicaDominican RepublicEastern AfricaEastern AsiaEastern EuropeEcuadorEgyptEl SalvadorEnglandEritreaEthiopiaEuropeFijiFranceGermanyGhanaGreeceGrenadaGuatemalaGuyanaHaitiHondurasHong KongHungaryIndiaIndonesiaIranIraqIrelandIsraelItalyJamaicaJapanJordanKazakhstanKenyaKoreaKuwaitLaosLatin AmericaLatviaLebanonLiberiaLithuaniaMalaysiaMicronesiaMiddle AfricaMoldovaMoroccoNepalNetherlandsNicaraguaNigeriaNorth AmericaNorth MacedoniaNorthern AfricaNorthern EuropeNorwayOceaniaPakistanPanamaPeruPhilippinesPolandPortugalRomaniaRussiaSaudi ArabiaScotlandSenegalSerbiaSierra LeoneSingaporeSomaliaSouth AfricaSouth AmericaSouth Central AsiaSouth Eastern AsiaSouthern EuropeSpainSri LankaSt. Vincent and the GrenadinesSudanSwedenSwitzerlandSyriaTaiwanThailandTrinidad and TobagoTurkeyUgandaUkraineUruguayUzbekistanVenezuelaVietnamWest IndiesWestern AfricaWestern AsiaWestern EuropeYemenZaireZimbabweAzores
Immigrants from Mexico
Race
Ancestry
AfghanAfricanAlaska NativeAlaskan AthabascanAlbanianAleutAlsatianAmericanApacheArabArapahoArgentineanArmenianAssyrian/Chaldean/SyriacAustralianAustrianBahamianBangladeshiBarbadianBasqueBelgianBelizeanBermudanBhutaneseBlackfeetBolivianBrazilianBritishBritish West IndianBulgarianBurmeseCajunCambodianCanadianCape VerdeanCarpatho RusynCelticCentral AmericanCentral American IndianCheyenneChickasawChileanChineseChippewaChoctawColombianColvilleComancheCosta RicanCreeCreekCroatianCrowCubanCypriotCzechCzechoslovakianDanishDelawareDominicanDutchDutch West IndianEastern EuropeanEcuadorianEgyptianEnglishEstonianEthiopianEuropeanFijianFilipinoFinnishFrenchFrench American IndianFrench CanadianGermanGerman RussianGhanaianGreekGuamanian/ChamorroGuatemalanGuyaneseHaitianHmongHonduranHopiHoumaHungarianIcelanderIndian (Asian)IndonesianInupiatIranianIraqiIrishIroquoisIsraeliItalianJamaicanJapaneseJordanianKenyanKiowaKoreanLaotianLatvianLebaneseLiberianLithuanianLumbeeLuxembourgerMacedonianMalaysianMalteseMarshalleseMenomineeMexicanMexican American IndianMongolianMoroccanNative HawaiianNavajoNepaleseNew ZealanderNicaraguanNigerianNorthern EuropeanNorwegianOkinawanOsageOttawaPaiutePakistaniPalestinianPanamanianParaguayanPennsylvania GermanPeruvianPimaPolishPortuguesePotawatomiPuebloPuerto RicanPuget Sound SalishRomanianRussianSalvadoranSamoanScandinavianScotch-IrishScottishSeminoleSenegaleseSerbianShoshoneSierra LeoneanSiouxSlavicSlovakSloveneSomaliSouth AfricanSouth AmericanSouth American IndianSoviet UnionSpaniardSpanishSpanish AmericanSpanish American IndianSri LankanSubsaharan AfricanSudaneseSwedishSwissSyrianTaiwaneseThaiTlingit-HaidaTohono O'OdhamTonganTrinidadian and TobagonianTsimshianTurkishU.S. Virgin IslanderUgandanUkrainianUruguayanUteVenezuelanVietnameseWelshWest IndianYakamaYaquiYugoslavianYumanYup'ikZimbabwean
Immigration
NonimmigrantsImmigrantsAfghanistanAfricaAlbaniaArgentinaArmeniaAsiaAustraliaAustriaBahamasBangladeshBarbadosBelarusBelgiumBelizeBoliviaBosnia and HerzegovinaBrazilBulgariaBurma/MyanmarCabo VerdeCambodiaCameroonCanadaCaribbeanCentral AmericaChileChinaColombiaCongoCosta RicaCroatiaCubaCzechoslovakiaDenmarkDominicaDominican RepublicEastern AfricaEastern AsiaEastern EuropeEcuadorEgyptEl SalvadorEnglandEritreaEthiopiaEuropeFijiFranceGermanyGhanaGreeceGrenadaGuatemalaGuyanaHaitiHondurasHong KongHungaryIndiaIndonesiaIranIraqIrelandIsraelItalyJamaicaJapanJordanKazakhstanKenyaKoreaKuwaitLaosLatin AmericaLatviaLebanonLiberiaLithuaniaMalaysiaMexicoMicronesiaMiddle AfricaMoldovaMoroccoNepalNetherlandsNicaraguaNigeriaNorth AmericaNorth MacedoniaNorthern AfricaNorthern EuropeNorwayOceaniaPakistanPanamaPeruPhilippinesPolandPortugalRomaniaRussiaSaudi ArabiaScotlandSenegalSerbiaSierra LeoneSingaporeSomaliaSouth AfricaSouth AmericaSouth Central AsiaSouth Eastern AsiaSouthern EuropeSpainSri LankaSt. Vincent and the GrenadinesSudanSwedenSwitzerlandSyriaTaiwanThailandTrinidad and TobagoTurkeyUgandaUkraineUruguayUzbekistanVenezuelaVietnamWest IndiesWestern AfricaWestern AsiaWestern EuropeYemenZaireZimbabweAzores
Single Father Poverty
Income
Poverty
Unemployment
Labor Participation
Family Structure
Vehicle Availability
Education Level
Disability

Single Father Poverty Comparison

Cherokee

Immigrants from Mexico

Tragic
Excellent
19.6%
SINGLE FATHER POVERTY
0.0/ 100
METRIC RATING
321st/ 347
METRIC RANK
16.0%
SINGLE FATHER POVERTY
83.3/ 100
METRIC RATING
142nd/ 347
METRIC RANK

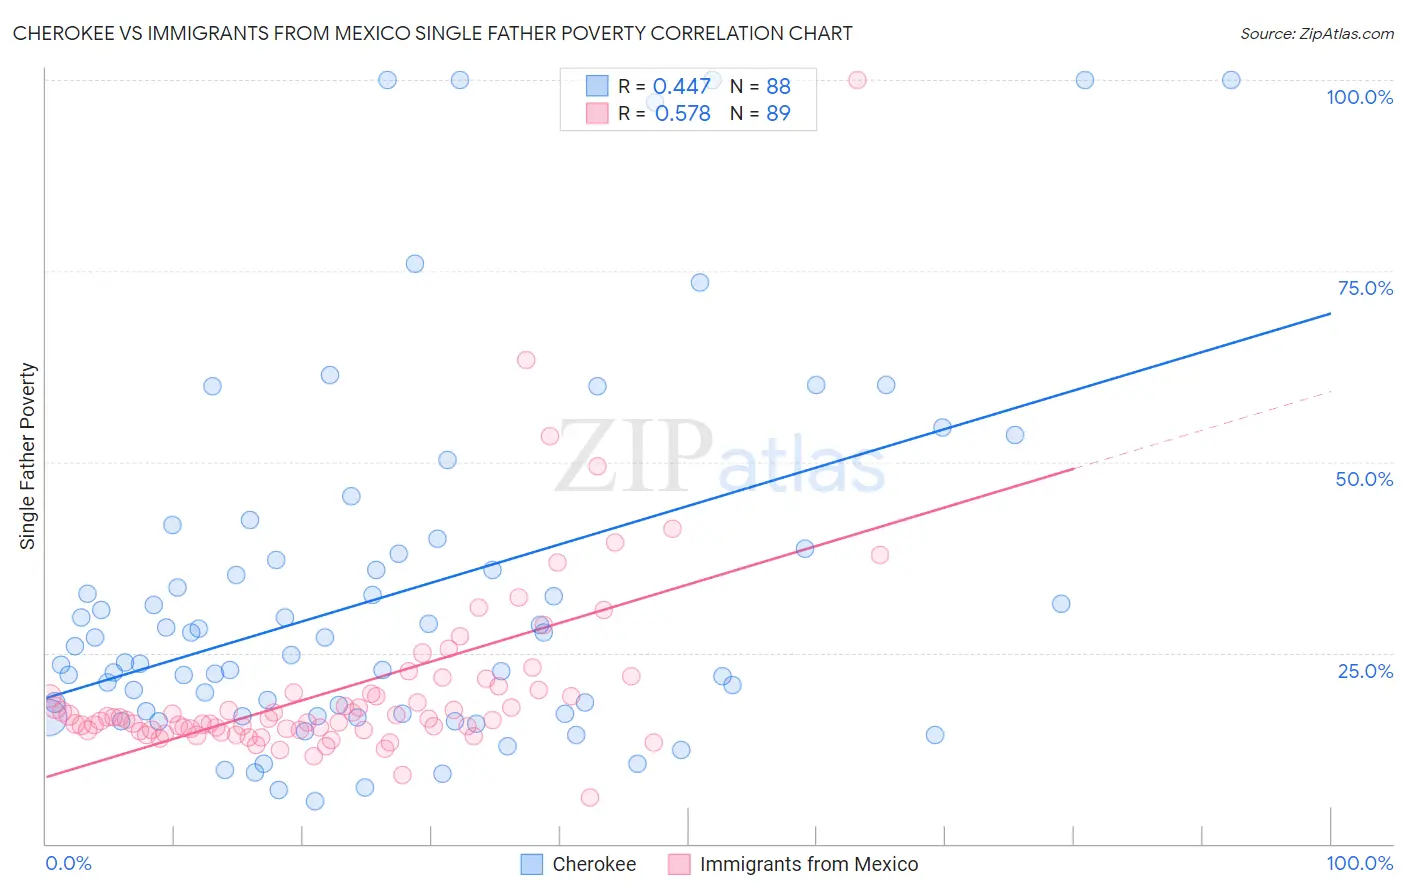
Cherokee vs Immigrants from Mexico Single Father Poverty Correlation Chart

The statistical analysis conducted on geographies consisting of 376,598,860 people shows a moderate positive correlation between the proportion of Cherokee and poverty level among single fathers in the United States with a correlation coefficient (R) of 0.447 and weighted average of 19.6%. Similarly, the statistical analysis conducted on geographies consisting of 385,763,473 people shows a substantial positive correlation between the proportion of Immigrants from Mexico and poverty level among single fathers in the United States with a correlation coefficient (R) of 0.578 and weighted average of 16.0%, a difference of 22.7%.
Cherokee vs Immigrants from Mexico Single Father Poverty

Single Father Poverty Correlation Summary

MeasurementCherokeeImmigrants from Mexico
Minimum5.6%6.0%
Maximum100.0%100.0%
Range94.4%94.0%
Mean32.7%20.3%
Median25.3%16.3%
Interquartile 25% (IQ1)17.1%14.9%
Interquartile 75% (IQ3)37.5%20.0%
Interquartile Range (IQR)20.4%5.1%
Standard Deviation (Sample)23.5%12.6%
Standard Deviation (Population)23.4%12.5%

Similar Demographics by Single Father Poverty

Demographics Similar to Cherokee by Single Father Poverty

In terms of single father poverty, the demographic groups most similar to Cherokee are Inupiat (19.5%, a difference of 0.85%), Creek (19.8%, a difference of 1.0%), Slovak (19.3%, a difference of 1.8%), Pennsylvania German (20.0%, a difference of 1.9%), and American (20.1%, a difference of 2.1%).
DemographicsRating | RankSingle Father Poverty
Delaware
0.0
/100
|
#314
Tragic
18.9%
Chickasaw
0.0
/100
|
#315
Tragic
19.0%
Osage
0.0
/100
|
#316
Tragic
19.0%
Dominicans
0.0
/100
|
#317
Tragic
19.1%
Dutch West Indians
0.0
/100
|
#318
Tragic
19.2%
Slovaks
0.0
/100
|
#319
Tragic
19.3%
Inupiat
0.0
/100
|
#320
Tragic
19.5%
Cherokee
0.0
/100
|
#321
Tragic
19.6%
Creek
0.0
/100
|
#322
Tragic
19.8%
Pennsylvania Germans
0.0
/100
|
#323
Tragic
20.0%
Americans
0.0
/100
|
#324
Tragic
20.1%
Blacks/African Americans
0.0
/100
|
#325
Tragic
20.4%
Immigrants | Yemen
0.0
/100
|
#326
Tragic
20.6%
Choctaw
0.0
/100
|
#327
Tragic
20.7%
Pueblo
0.0
/100
|
#328
Tragic
21.1%

Demographics Similar to Immigrants from Mexico by Single Father Poverty

In terms of single father poverty, the demographic groups most similar to Immigrants from Mexico are Liberian (16.0%, a difference of 0.0%), Immigrants from Central America (16.0%, a difference of 0.020%), Immigrants from Kuwait (16.0%, a difference of 0.15%), Immigrants from Netherlands (16.0%, a difference of 0.17%), and Immigrants from Western Asia (16.0%, a difference of 0.20%).
DemographicsRating | RankSingle Father Poverty
Immigrants | Sri Lanka
88.2
/100
|
#135
Excellent
15.9%
Cypriots
87.5
/100
|
#136
Excellent
15.9%
Immigrants | Azores
87.2
/100
|
#137
Excellent
15.9%
Central Americans
87.1
/100
|
#138
Excellent
16.0%
South Americans
85.9
/100
|
#139
Excellent
16.0%
Immigrants | Netherlands
85.3
/100
|
#140
Excellent
16.0%
Liberians
83.3
/100
|
#141
Excellent
16.0%
Immigrants | Mexico
83.3
/100
|
#142
Excellent
16.0%
Immigrants | Central America
83.1
/100
|
#143
Excellent
16.0%
Immigrants | Kuwait
81.4
/100
|
#144
Excellent
16.0%
Immigrants | Western Asia
80.7
/100
|
#145
Excellent
16.0%
Immigrants | Hungary
78.3
/100
|
#146
Good
16.1%
Colombians
77.1
/100
|
#147
Good
16.1%
Nigerians
76.8
/100
|
#148
Good
16.1%
South Africans
75.1
/100
|
#149
Good
16.1%