Central American vs Immigrants from Oceania Child Poverty Among Girls Under 16

COMPARE

Central American
Race
Ancestry
AfghanAfricanAlaska NativeAlaskan AthabascanAlbanianAleutAlsatianAmericanApacheArabArapahoArgentineanArmenianAssyrian/Chaldean/SyriacAustralianAustrianBahamianBangladeshiBarbadianBasqueBelgianBelizeanBermudanBhutaneseBlackfeetBolivianBrazilianBritishBritish West IndianBulgarianBurmeseCajunCambodianCanadianCape VerdeanCarpatho RusynCelticCentral AmericanCentral American IndianCherokeeCheyenneChickasawChileanChineseChippewaChoctawColombianColvilleComancheCosta RicanCreeCreekCroatianCrowCubanCypriotCzechCzechoslovakianDanishDelawareDominicanDutchDutch West IndianEastern EuropeanEcuadorianEgyptianEnglishEstonianEthiopianEuropeanFijianFilipinoFinnishFrenchFrench American IndianFrench CanadianGermanGerman RussianGhanaianGreekGuamanian/ChamorroGuatemalanGuyaneseHaitianHmongHonduranHopiHoumaHungarianIcelanderIndian (Asian)IndonesianInupiatIranianIraqiIrishIroquoisIsraeliItalianJamaicanJapaneseJordanianKenyanKiowaKoreanLaotianLatvianLebaneseLiberianLithuanianLumbeeLuxembourgerMacedonianMalaysianMalteseMarshalleseMenomineeMexicanMexican American IndianMongolianMoroccanNative HawaiianNavajoNepaleseNew ZealanderNicaraguanNigerianNorthern EuropeanNorwegianOkinawanOsageOttawaPaiutePakistaniPalestinianPanamanianParaguayanPennsylvania GermanPeruvianPimaPolishPortuguesePotawatomiPuebloPuerto RicanPuget Sound SalishRomanianRussianSalvadoranSamoanScandinavianScotch-IrishScottishSeminoleSenegaleseSerbianShoshoneSierra LeoneanSiouxSlavicSlovakSloveneSomaliSouth AfricanSouth AmericanSouth American IndianSoviet UnionSpaniardSpanishSpanish AmericanSpanish American IndianSri LankanSubsaharan AfricanSudaneseSwedishSwissSyrianTaiwaneseThaiTlingit-HaidaTohono O'OdhamTonganTrinidadian and TobagonianTsimshianTurkishU.S. Virgin IslanderUgandanUkrainianUruguayanUteVenezuelanVietnameseWelshWest IndianYakamaYaquiYugoslavianYumanYup'ikZimbabwean
Immigration
NonimmigrantsImmigrantsAfghanistanAfricaAlbaniaArgentinaArmeniaAsiaAustraliaAustriaBahamasBangladeshBarbadosBelarusBelgiumBelizeBoliviaBosnia and HerzegovinaBrazilBulgariaBurma/MyanmarCabo VerdeCambodiaCameroonCanadaCaribbeanCentral AmericaChileChinaColombiaCongoCosta RicaCroatiaCubaCzechoslovakiaDenmarkDominicaDominican RepublicEastern AfricaEastern AsiaEastern EuropeEcuadorEgyptEl SalvadorEnglandEritreaEthiopiaEuropeFijiFranceGermanyGhanaGreeceGrenadaGuatemalaGuyanaHaitiHondurasHong KongHungaryIndiaIndonesiaIranIraqIrelandIsraelItalyJamaicaJapanJordanKazakhstanKenyaKoreaKuwaitLaosLatin AmericaLatviaLebanonLiberiaLithuaniaMalaysiaMexicoMicronesiaMiddle AfricaMoldovaMoroccoNepalNetherlandsNicaraguaNigeriaNorth AmericaNorth MacedoniaNorthern AfricaNorthern EuropeNorwayPakistanPanamaPeruPhilippinesPolandPortugalRomaniaRussiaSaudi ArabiaScotlandSenegalSerbiaSierra LeoneSingaporeSomaliaSouth AfricaSouth AmericaSouth Central AsiaSouth Eastern AsiaSouthern EuropeSpainSri LankaSt. Vincent and the GrenadinesSudanSwedenSwitzerlandSyriaTaiwanThailandTrinidad and TobagoTurkeyUgandaUkraineUruguayUzbekistanVenezuelaVietnamWest IndiesWestern AfricaWestern AsiaWestern EuropeYemenZaireZimbabweAzores
Immigrants from Oceania
Race
Ancestry
AfghanAfricanAlaska NativeAlaskan AthabascanAlbanianAleutAlsatianAmericanApacheArabArapahoArgentineanArmenianAssyrian/Chaldean/SyriacAustralianAustrianBahamianBangladeshiBarbadianBasqueBelgianBelizeanBermudanBhutaneseBlackfeetBolivianBrazilianBritishBritish West IndianBulgarianBurmeseCajunCambodianCanadianCape VerdeanCarpatho RusynCelticCentral American IndianCherokeeCheyenneChickasawChileanChineseChippewaChoctawColombianColvilleComancheCosta RicanCreeCreekCroatianCrowCubanCypriotCzechCzechoslovakianDanishDelawareDominicanDutchDutch West IndianEastern EuropeanEcuadorianEgyptianEnglishEstonianEthiopianEuropeanFijianFilipinoFinnishFrenchFrench American IndianFrench CanadianGermanGerman RussianGhanaianGreekGuamanian/ChamorroGuatemalanGuyaneseHaitianHmongHonduranHopiHoumaHungarianIcelanderIndian (Asian)IndonesianInupiatIranianIraqiIrishIroquoisIsraeliItalianJamaicanJapaneseJordanianKenyanKiowaKoreanLaotianLatvianLebaneseLiberianLithuanianLumbeeLuxembourgerMacedonianMalaysianMalteseMarshalleseMenomineeMexicanMexican American IndianMongolianMoroccanNative HawaiianNavajoNepaleseNew ZealanderNicaraguanNigerianNorthern EuropeanNorwegianOkinawanOsageOttawaPaiutePakistaniPalestinianPanamanianParaguayanPennsylvania GermanPeruvianPimaPolishPortuguesePotawatomiPuebloPuerto RicanPuget Sound SalishRomanianRussianSalvadoranSamoanScandinavianScotch-IrishScottishSeminoleSenegaleseSerbianShoshoneSierra LeoneanSiouxSlavicSlovakSloveneSomaliSouth AfricanSouth AmericanSouth American IndianSoviet UnionSpaniardSpanishSpanish AmericanSpanish American IndianSri LankanSubsaharan AfricanSudaneseSwedishSwissSyrianTaiwaneseThaiTlingit-HaidaTohono O'OdhamTonganTrinidadian and TobagonianTsimshianTurkishU.S. Virgin IslanderUgandanUkrainianUruguayanUteVenezuelanVietnameseWelshWest IndianYakamaYaquiYugoslavianYumanYup'ikZimbabwean
Immigration
NonimmigrantsImmigrantsAfghanistanAfricaAlbaniaArgentinaArmeniaAsiaAustraliaAustriaBahamasBangladeshBarbadosBelarusBelgiumBelizeBoliviaBosnia and HerzegovinaBrazilBulgariaBurma/MyanmarCabo VerdeCambodiaCameroonCanadaCaribbeanCentral AmericaChileChinaColombiaCongoCosta RicaCroatiaCubaCzechoslovakiaDenmarkDominicaDominican RepublicEastern AfricaEastern AsiaEastern EuropeEcuadorEgyptEl SalvadorEnglandEritreaEthiopiaEuropeFijiFranceGermanyGhanaGreeceGrenadaGuatemalaGuyanaHaitiHondurasHong KongHungaryIndiaIndonesiaIranIraqIrelandIsraelItalyJamaicaJapanJordanKazakhstanKenyaKoreaKuwaitLaosLatin AmericaLatviaLebanonLiberiaLithuaniaMalaysiaMexicoMicronesiaMiddle AfricaMoldovaMoroccoNepalNetherlandsNicaraguaNigeriaNorth AmericaNorth MacedoniaNorthern AfricaNorthern EuropeNorwayOceaniaPakistanPanamaPeruPhilippinesPolandPortugalRomaniaRussiaSaudi ArabiaScotlandSenegalSerbiaSierra LeoneSingaporeSomaliaSouth AfricaSouth AmericaSouth Central AsiaSouth Eastern AsiaSouthern EuropeSpainSri LankaSt. Vincent and the GrenadinesSudanSwedenSwitzerlandSyriaTaiwanThailandTrinidad and TobagoTurkeyUgandaUkraineUruguayUzbekistanVenezuelaVietnamWest IndiesWestern AfricaWestern AsiaWestern EuropeYemenZaireZimbabweAzores
Child Poverty Among Girls Under 16
Income
Poverty
Unemployment
Labor Participation
Family Structure
Vehicle Availability
Education Level
Disability

Child Poverty Among Girls Under 16 Comparison

Central Americans

Immigrants from Oceania

Tragic
Good
20.2%
CHILD POVERTY AMONG GIRLS UNDER 16
0.0/ 100
METRIC RATING
281st/ 347
METRIC RANK
16.1%
CHILD POVERTY AMONG GIRLS UNDER 16
68.4/ 100
METRIC RATING
163rd/ 347
METRIC RANK

Central American vs Immigrants from Oceania Child Poverty Among Girls Under 16 Correlation Chart

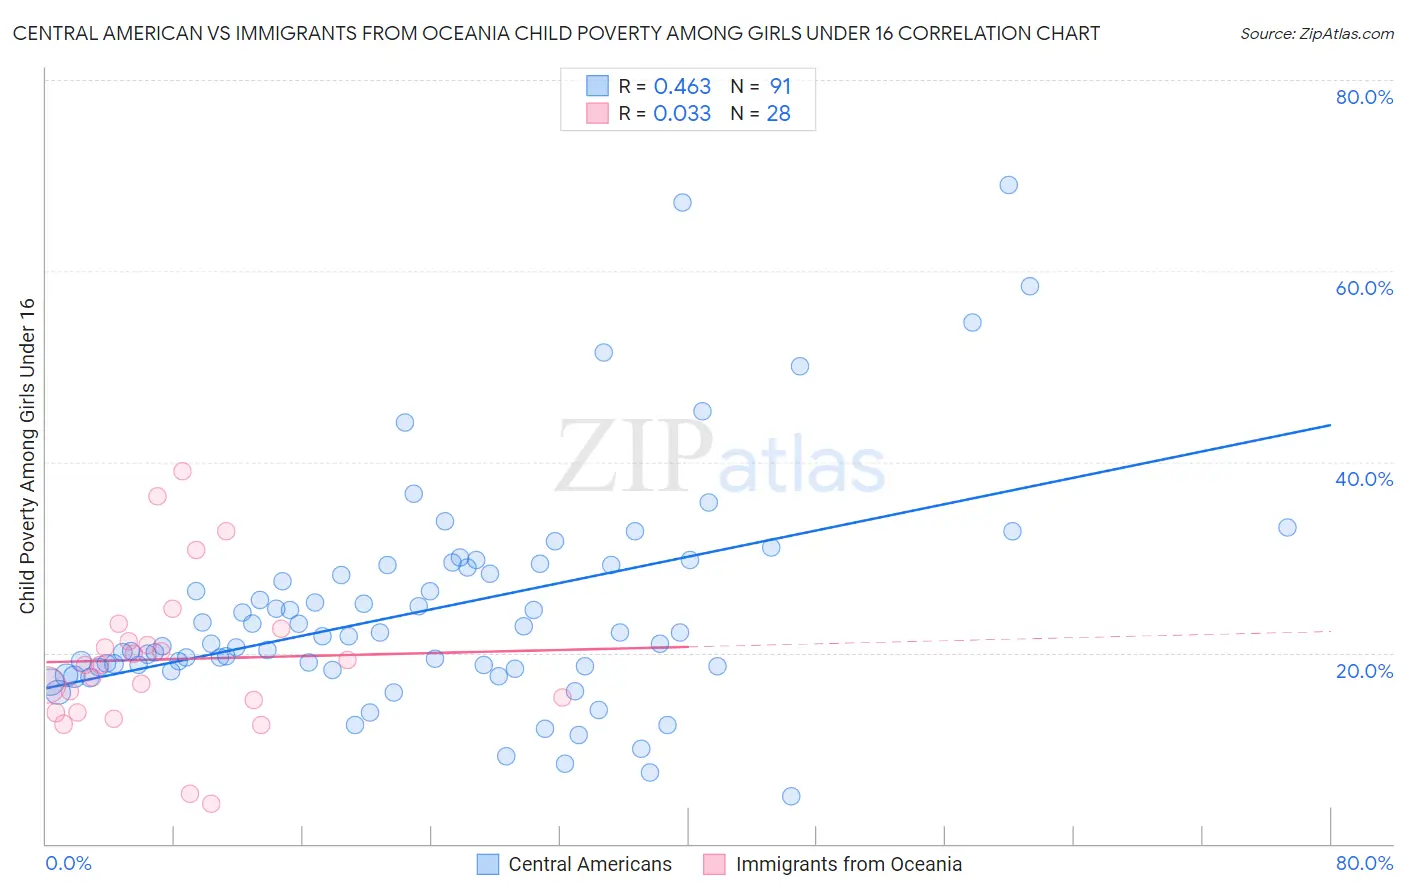
The statistical analysis conducted on geographies consisting of 492,924,631 people shows a moderate positive correlation between the proportion of Central Americans and poverty level among girls under the age of 16 in the United States with a correlation coefficient (R) of 0.463 and weighted average of 20.2%. Similarly, the statistical analysis conducted on geographies consisting of 301,068,502 people shows no correlation between the proportion of Immigrants from Oceania and poverty level among girls under the age of 16 in the United States with a correlation coefficient (R) of 0.033 and weighted average of 16.1%, a difference of 25.7%.
Central American vs Immigrants from Oceania Child Poverty Among Girls Under 16

Child Poverty Among Girls Under 16 Correlation Summary

MeasurementCentral AmericanImmigrants from Oceania
Minimum4.9%4.3%
Maximum69.0%39.0%
Range64.1%34.8%
Mean24.6%19.3%
Median21.7%18.7%
Interquartile 25% (IQ1)18.5%14.4%
Interquartile 75% (IQ3)29.2%21.9%
Interquartile Range (IQR)10.7%7.5%
Standard Deviation (Sample)11.7%8.0%
Standard Deviation (Population)11.7%7.9%

Similar Demographics by Child Poverty Among Girls Under 16

Demographics Similar to Central Americans by Child Poverty Among Girls Under 16

In terms of child poverty among girls under 16, the demographic groups most similar to Central Americans are Immigrants from Liberia (20.2%, a difference of 0.070%), Immigrants from Zaire (20.2%, a difference of 0.080%), Barbadian (20.2%, a difference of 0.21%), Belizean (20.2%, a difference of 0.24%), and West Indian (20.3%, a difference of 0.28%).
DemographicsRating | RankChild Poverty Among Girls Under 16
Immigrants | St. Vincent and the Grenadines
0.0
/100
|
#274
Tragic
20.1%
Sub-Saharan Africans
0.0
/100
|
#275
Tragic
20.1%
Comanche
0.0
/100
|
#276
Tragic
20.2%
Belizeans
0.0
/100
|
#277
Tragic
20.2%
Barbadians
0.0
/100
|
#278
Tragic
20.2%
Immigrants | Zaire
0.0
/100
|
#279
Tragic
20.2%
Immigrants | Liberia
0.0
/100
|
#280
Tragic
20.2%
Central Americans
0.0
/100
|
#281
Tragic
20.2%
West Indians
0.0
/100
|
#282
Tragic
20.3%
Senegalese
0.0
/100
|
#283
Tragic
20.3%
Yaqui
0.0
/100
|
#284
Tragic
20.3%
Immigrants | Cabo Verde
0.0
/100
|
#285
Tragic
20.3%
Iroquois
0.0
/100
|
#286
Tragic
20.4%
Blackfeet
0.0
/100
|
#287
Tragic
20.5%
Haitians
0.0
/100
|
#288
Tragic
20.5%

Demographics Similar to Immigrants from Oceania by Child Poverty Among Girls Under 16

In terms of child poverty among girls under 16, the demographic groups most similar to Immigrants from Oceania are French Canadian (16.1%, a difference of 0.050%), Immigrants from Colombia (16.1%, a difference of 0.070%), Immigrants from Germany (16.1%, a difference of 0.14%), South American (16.1%, a difference of 0.16%), and Uruguayan (16.2%, a difference of 0.48%).
DemographicsRating | RankChild Poverty Among Girls Under 16
Immigrants | Fiji
76.1
/100
|
#156
Good
15.9%
Colombians
76.1
/100
|
#157
Good
15.9%
Guamanians/Chamorros
75.3
/100
|
#158
Good
15.9%
Slovaks
75.2
/100
|
#159
Good
15.9%
French
72.8
/100
|
#160
Good
16.0%
Immigrants | Northern Africa
72.0
/100
|
#161
Good
16.0%
French Canadians
68.7
/100
|
#162
Good
16.1%
Immigrants | Oceania
68.4
/100
|
#163
Good
16.1%
Immigrants | Colombia
67.8
/100
|
#164
Good
16.1%
Immigrants | Germany
67.3
/100
|
#165
Good
16.1%
South Americans
67.2
/100
|
#166
Good
16.1%
Uruguayans
64.7
/100
|
#167
Good
16.2%
Yugoslavians
64.4
/100
|
#168
Good
16.2%
Costa Ricans
64.2
/100
|
#169
Good
16.2%
Immigrants | Venezuela
64.2
/100
|
#170
Good
16.2%