Central American vs Tsimshian Child Poverty Among Girls Under 16

COMPARE

Central American
Race
Ancestry
AfghanAfricanAlaska NativeAlaskan AthabascanAlbanianAleutAlsatianAmericanApacheArabArapahoArgentineanArmenianAssyrian/Chaldean/SyriacAustralianAustrianBahamianBangladeshiBarbadianBasqueBelgianBelizeanBermudanBhutaneseBlackfeetBolivianBrazilianBritishBritish West IndianBulgarianBurmeseCajunCambodianCanadianCape VerdeanCarpatho RusynCelticCentral AmericanCentral American IndianCherokeeCheyenneChickasawChileanChineseChippewaChoctawColombianColvilleComancheCosta RicanCreeCreekCroatianCrowCubanCypriotCzechCzechoslovakianDanishDelawareDominicanDutchDutch West IndianEastern EuropeanEcuadorianEgyptianEnglishEstonianEthiopianEuropeanFijianFilipinoFinnishFrenchFrench American IndianFrench CanadianGermanGerman RussianGhanaianGreekGuamanian/ChamorroGuatemalanGuyaneseHaitianHmongHonduranHopiHoumaHungarianIcelanderIndian (Asian)IndonesianInupiatIranianIraqiIrishIroquoisIsraeliItalianJamaicanJapaneseJordanianKenyanKiowaKoreanLaotianLatvianLebaneseLiberianLithuanianLumbeeLuxembourgerMacedonianMalaysianMalteseMarshalleseMenomineeMexicanMexican American IndianMongolianMoroccanNative HawaiianNavajoNepaleseNew ZealanderNicaraguanNigerianNorthern EuropeanNorwegianOkinawanOsageOttawaPaiutePakistaniPalestinianPanamanianParaguayanPennsylvania GermanPeruvianPimaPolishPortuguesePotawatomiPuebloPuerto RicanPuget Sound SalishRomanianRussianSalvadoranSamoanScandinavianScotch-IrishScottishSeminoleSenegaleseSerbianShoshoneSierra LeoneanSiouxSlavicSlovakSloveneSomaliSouth AfricanSouth AmericanSouth American IndianSoviet UnionSpaniardSpanishSpanish AmericanSpanish American IndianSri LankanSubsaharan AfricanSudaneseSwedishSwissSyrianTaiwaneseThaiTlingit-HaidaTohono O'OdhamTonganTrinidadian and TobagonianTurkishU.S. Virgin IslanderUgandanUkrainianUruguayanUteVenezuelanVietnameseWelshWest IndianYakamaYaquiYugoslavianYumanYup'ikZimbabwean
Immigration
NonimmigrantsImmigrantsAfghanistanAfricaAlbaniaArgentinaArmeniaAsiaAustraliaAustriaBahamasBangladeshBarbadosBelarusBelgiumBelizeBoliviaBosnia and HerzegovinaBrazilBulgariaBurma/MyanmarCabo VerdeCambodiaCameroonCanadaCaribbeanCentral AmericaChileChinaColombiaCongoCosta RicaCroatiaCubaCzechoslovakiaDenmarkDominicaDominican RepublicEastern AfricaEastern AsiaEastern EuropeEcuadorEgyptEl SalvadorEnglandEritreaEthiopiaEuropeFijiFranceGermanyGhanaGreeceGrenadaGuatemalaGuyanaHaitiHondurasHong KongHungaryIndiaIndonesiaIranIraqIrelandIsraelItalyJamaicaJapanJordanKazakhstanKenyaKoreaKuwaitLaosLatin AmericaLatviaLebanonLiberiaLithuaniaMalaysiaMexicoMicronesiaMiddle AfricaMoldovaMoroccoNepalNetherlandsNicaraguaNigeriaNorth AmericaNorth MacedoniaNorthern AfricaNorthern EuropeNorwayOceaniaPakistanPanamaPeruPhilippinesPolandPortugalRomaniaRussiaSaudi ArabiaScotlandSenegalSerbiaSierra LeoneSingaporeSomaliaSouth AfricaSouth AmericaSouth Central AsiaSouth Eastern AsiaSouthern EuropeSpainSri LankaSt. Vincent and the GrenadinesSudanSwedenSwitzerlandSyriaTaiwanThailandTrinidad and TobagoTurkeyUgandaUkraineUruguayUzbekistanVenezuelaVietnamWest IndiesWestern AfricaWestern AsiaWestern EuropeYemenZaireZimbabweAzores
Tsimshian
Race
Ancestry
AfghanAfricanAlaska NativeAlaskan AthabascanAlbanianAleutAlsatianAmericanApacheArabArapahoArgentineanArmenianAssyrian/Chaldean/SyriacAustralianAustrianBahamianBangladeshiBarbadianBasqueBelgianBelizeanBermudanBhutaneseBlackfeetBolivianBrazilianBritishBritish West IndianBulgarianBurmeseCajunCambodianCanadianCape VerdeanCarpatho RusynCelticCentral American IndianCherokeeCheyenneChickasawChileanChineseChippewaChoctawColombianColvilleComancheCosta RicanCreeCreekCroatianCrowCubanCypriotCzechCzechoslovakianDanishDelawareDominicanDutchDutch West IndianEastern EuropeanEcuadorianEgyptianEnglishEstonianEthiopianEuropeanFijianFilipinoFinnishFrenchFrench American IndianFrench CanadianGermanGerman RussianGhanaianGreekGuamanian/ChamorroGuatemalanGuyaneseHaitianHmongHonduranHopiHoumaHungarianIcelanderIndian (Asian)IndonesianInupiatIranianIraqiIrishIroquoisIsraeliItalianJamaicanJapaneseJordanianKenyanKiowaKoreanLaotianLatvianLebaneseLiberianLithuanianLumbeeLuxembourgerMacedonianMalaysianMalteseMarshalleseMenomineeMexicanMexican American IndianMongolianMoroccanNative HawaiianNavajoNepaleseNew ZealanderNicaraguanNigerianNorthern EuropeanNorwegianOkinawanOsageOttawaPaiutePakistaniPalestinianPanamanianParaguayanPennsylvania GermanPeruvianPimaPolishPortuguesePotawatomiPuebloPuerto RicanPuget Sound SalishRomanianRussianSalvadoranSamoanScandinavianScotch-IrishScottishSeminoleSenegaleseSerbianShoshoneSierra LeoneanSiouxSlavicSlovakSloveneSomaliSouth AfricanSouth AmericanSouth American IndianSoviet UnionSpaniardSpanishSpanish AmericanSpanish American IndianSri LankanSubsaharan AfricanSudaneseSwedishSwissSyrianTaiwaneseThaiTlingit-HaidaTohono O'OdhamTonganTrinidadian and TobagonianTsimshianTurkishU.S. Virgin IslanderUgandanUkrainianUruguayanUteVenezuelanVietnameseWelshWest IndianYakamaYaquiYugoslavianYumanYup'ikZimbabwean
Immigration
NonimmigrantsImmigrantsAfghanistanAfricaAlbaniaArgentinaArmeniaAsiaAustraliaAustriaBahamasBangladeshBarbadosBelarusBelgiumBelizeBoliviaBosnia and HerzegovinaBrazilBulgariaBurma/MyanmarCabo VerdeCambodiaCameroonCanadaCaribbeanCentral AmericaChileChinaColombiaCongoCosta RicaCroatiaCubaCzechoslovakiaDenmarkDominicaDominican RepublicEastern AfricaEastern AsiaEastern EuropeEcuadorEgyptEl SalvadorEnglandEritreaEthiopiaEuropeFijiFranceGermanyGhanaGreeceGrenadaGuatemalaGuyanaHaitiHondurasHong KongHungaryIndiaIndonesiaIranIraqIrelandIsraelItalyJamaicaJapanJordanKazakhstanKenyaKoreaKuwaitLaosLatin AmericaLatviaLebanonLiberiaLithuaniaMalaysiaMexicoMicronesiaMiddle AfricaMoldovaMoroccoNepalNetherlandsNicaraguaNigeriaNorth AmericaNorth MacedoniaNorthern AfricaNorthern EuropeNorwayOceaniaPakistanPanamaPeruPhilippinesPolandPortugalRomaniaRussiaSaudi ArabiaScotlandSenegalSerbiaSierra LeoneSingaporeSomaliaSouth AfricaSouth AmericaSouth Central AsiaSouth Eastern AsiaSouthern EuropeSpainSri LankaSt. Vincent and the GrenadinesSudanSwedenSwitzerlandSyriaTaiwanThailandTrinidad and TobagoTurkeyUgandaUkraineUruguayUzbekistanVenezuelaVietnamWest IndiesWestern AfricaWestern AsiaWestern EuropeYemenZaireZimbabweAzores
Child Poverty Among Girls Under 16
Income
Poverty
Unemployment
Labor Participation
Family Structure
Vehicle Availability
Education Level
Disability

Child Poverty Among Girls Under 16 Comparison

Central Americans

Tsimshian

Tragic
Exceptional
20.2%
CHILD POVERTY AMONG GIRLS UNDER 16
0.0/ 100
METRIC RATING
281st/ 347
METRIC RANK
11.5%
CHILD POVERTY AMONG GIRLS UNDER 16
100.0/ 100
METRIC RATING
4th/ 347
METRIC RANK

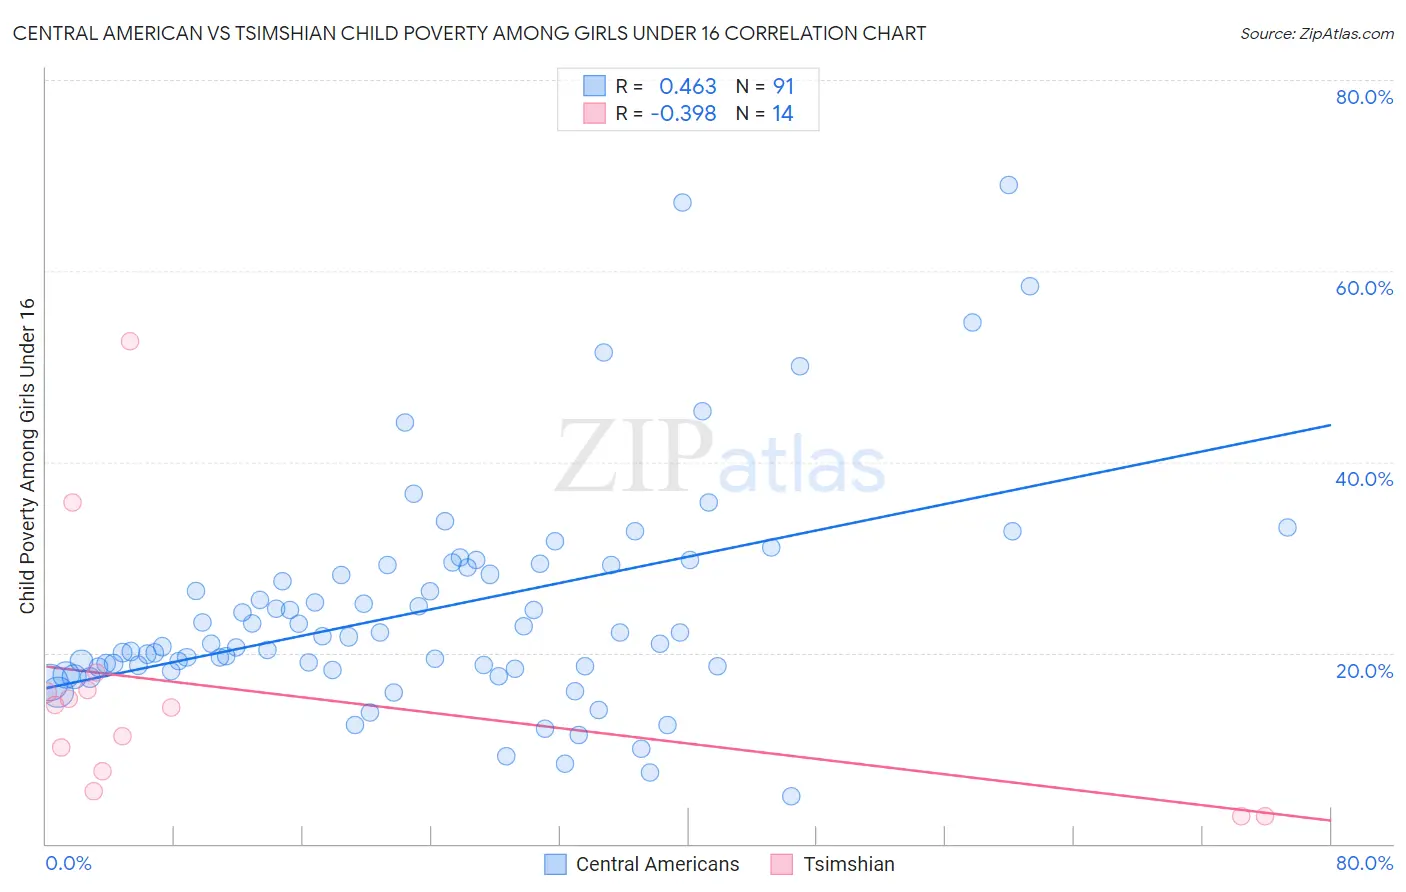
Central American vs Tsimshian Child Poverty Among Girls Under 16 Correlation Chart

The statistical analysis conducted on geographies consisting of 492,924,631 people shows a moderate positive correlation between the proportion of Central Americans and poverty level among girls under the age of 16 in the United States with a correlation coefficient (R) of 0.463 and weighted average of 20.2%. Similarly, the statistical analysis conducted on geographies consisting of 15,575,613 people shows a mild negative correlation between the proportion of Tsimshian and poverty level among girls under the age of 16 in the United States with a correlation coefficient (R) of -0.398 and weighted average of 11.5%, a difference of 76.4%.
Central American vs Tsimshian Child Poverty Among Girls Under 16

Child Poverty Among Girls Under 16 Correlation Summary

MeasurementCentral AmericanTsimshian
Minimum4.9%2.9%
Maximum69.0%52.6%
Range64.1%49.7%
Mean24.6%15.9%
Median21.7%14.4%
Interquartile 25% (IQ1)18.5%7.5%
Interquartile 75% (IQ3)29.2%16.1%
Interquartile Range (IQR)10.7%8.5%
Standard Deviation (Sample)11.7%13.4%
Standard Deviation (Population)11.7%12.9%

Similar Demographics by Child Poverty Among Girls Under 16

Demographics Similar to Central Americans by Child Poverty Among Girls Under 16

In terms of child poverty among girls under 16, the demographic groups most similar to Central Americans are Immigrants from Liberia (20.2%, a difference of 0.070%), Immigrants from Zaire (20.2%, a difference of 0.080%), Barbadian (20.2%, a difference of 0.21%), Belizean (20.2%, a difference of 0.24%), and West Indian (20.3%, a difference of 0.28%).
DemographicsRating | RankChild Poverty Among Girls Under 16
Immigrants | St. Vincent and the Grenadines
0.0
/100
|
#274
Tragic
20.1%
Sub-Saharan Africans
0.0
/100
|
#275
Tragic
20.1%
Comanche
0.0
/100
|
#276
Tragic
20.2%
Belizeans
0.0
/100
|
#277
Tragic
20.2%
Barbadians
0.0
/100
|
#278
Tragic
20.2%
Immigrants | Zaire
0.0
/100
|
#279
Tragic
20.2%
Immigrants | Liberia
0.0
/100
|
#280
Tragic
20.2%
Central Americans
0.0
/100
|
#281
Tragic
20.2%
West Indians
0.0
/100
|
#282
Tragic
20.3%
Senegalese
0.0
/100
|
#283
Tragic
20.3%
Yaqui
0.0
/100
|
#284
Tragic
20.3%
Immigrants | Cabo Verde
0.0
/100
|
#285
Tragic
20.3%
Iroquois
0.0
/100
|
#286
Tragic
20.4%
Blackfeet
0.0
/100
|
#287
Tragic
20.5%
Haitians
0.0
/100
|
#288
Tragic
20.5%

Demographics Similar to Tsimshian by Child Poverty Among Girls Under 16

In terms of child poverty among girls under 16, the demographic groups most similar to Tsimshian are Filipino (11.4%, a difference of 0.52%), Immigrants from Taiwan (11.3%, a difference of 1.4%), Thai (11.8%, a difference of 3.0%), Immigrants from India (11.0%, a difference of 4.1%), and Immigrants from Hong Kong (12.3%, a difference of 7.4%).
DemographicsRating | RankChild Poverty Among Girls Under 16
Immigrants | India
100.0
/100
|
#1
Exceptional
11.0%
Immigrants | Taiwan
100.0
/100
|
#2
Exceptional
11.3%
Filipinos
100.0
/100
|
#3
Exceptional
11.4%
Tsimshian
100.0
/100
|
#4
Exceptional
11.5%
Thais
100.0
/100
|
#5
Exceptional
11.8%
Immigrants | Hong Kong
100.0
/100
|
#6
Exceptional
12.3%
Chinese
100.0
/100
|
#7
Exceptional
12.3%
Iranians
100.0
/100
|
#8
Exceptional
12.4%
Immigrants | Singapore
100.0
/100
|
#9
Exceptional
12.5%
Immigrants | Iran
100.0
/100
|
#10
Exceptional
12.6%
Immigrants | South Central Asia
100.0
/100
|
#11
Exceptional
12.7%
Bhutanese
100.0
/100
|
#12
Exceptional
12.7%
Immigrants | Ireland
99.9
/100
|
#13
Exceptional
12.9%
Burmese
99.9
/100
|
#14
Exceptional
13.0%
Okinawans
99.9
/100
|
#15
Exceptional
13.0%