Blackfeet vs Chickasaw Male Poverty
COMPARE
Blackfeet
Chickasaw
Male Poverty
Male Poverty Comparison
Blackfeet
Chickasaw
14.0%
MALE POVERTY
0.0/ 100
METRIC RATING
298th/ 347
METRIC RANK
13.5%
MALE POVERTY
0.0/ 100
METRIC RATING
273rd/ 347
METRIC RANK
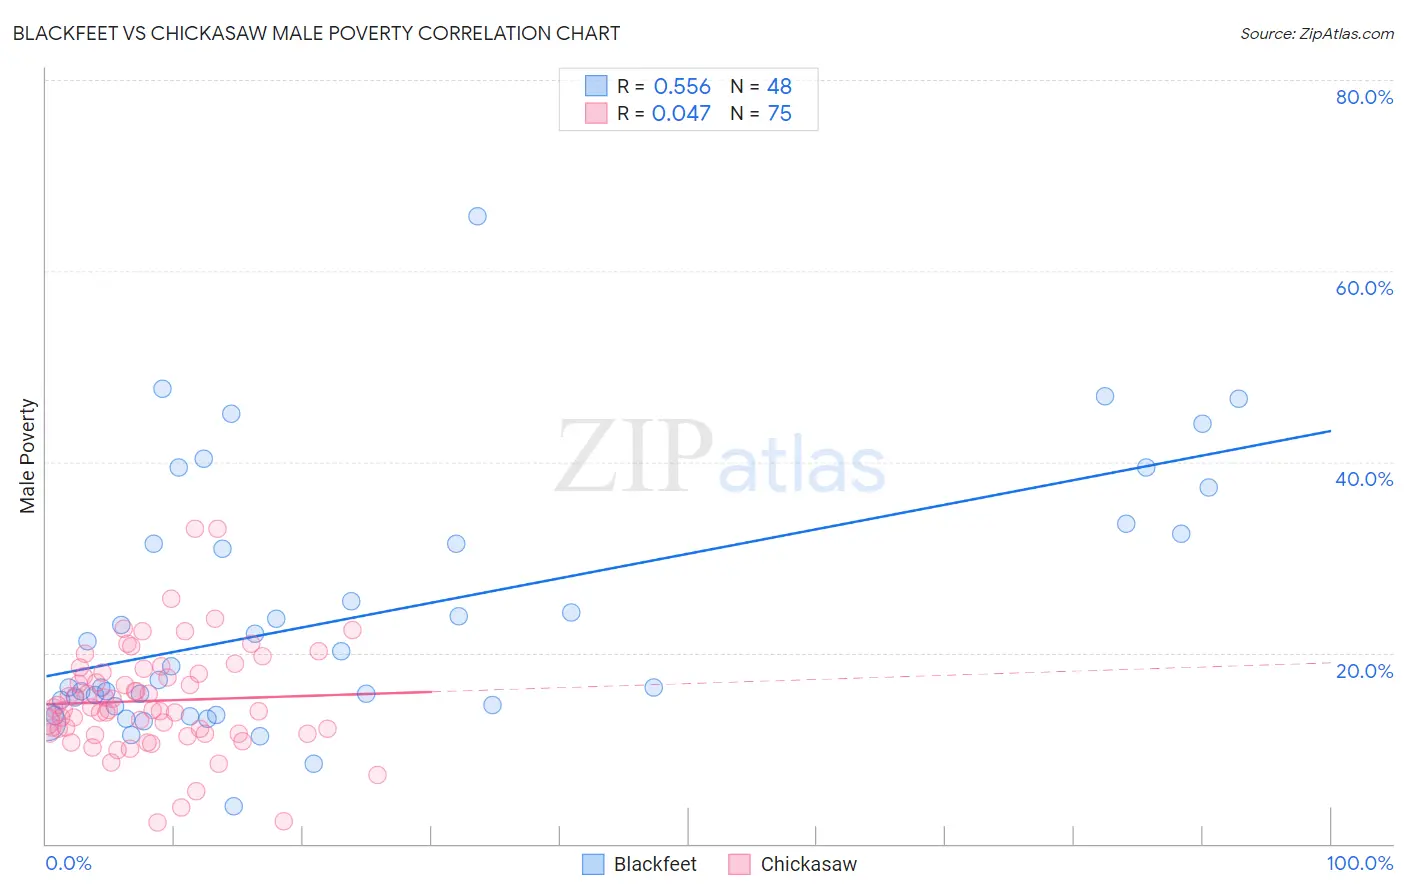
Blackfeet vs Chickasaw Male Poverty Correlation Chart
The statistical analysis conducted on geographies consisting of 309,436,017 people shows a substantial positive correlation between the proportion of Blackfeet and poverty level among males in the United States with a correlation coefficient (R) of 0.556 and weighted average of 14.0%. Similarly, the statistical analysis conducted on geographies consisting of 147,660,855 people shows no correlation between the proportion of Chickasaw and poverty level among males in the United States with a correlation coefficient (R) of 0.047 and weighted average of 13.5%, a difference of 3.8%.
Male Poverty Correlation Summary
| Measurement | Blackfeet | Chickasaw |
| Minimum | 3.9% | 2.2% |
| Maximum | 65.7% | 33.0% |
| Range | 61.8% | 30.8% |
| Mean | 23.9% | 15.0% |
| Median | 17.9% | 14.0% |
| Interquartile 25% (IQ1) | 14.4% | 11.6% |
| Interquartile 75% (IQ3) | 31.9% | 18.0% |
| Interquartile Range (IQR) | 17.5% | 6.4% |
| Standard Deviation (Sample) | 13.2% | 5.6% |
| Standard Deviation (Population) | 13.0% | 5.5% |
Similar Demographics by Male Poverty
Demographics Similar to Blackfeet by Male Poverty
In terms of male poverty, the demographic groups most similar to Blackfeet are Inupiat (14.0%, a difference of 0.030%), Immigrants from Guatemala (14.0%, a difference of 0.10%), Immigrants from Mexico (14.0%, a difference of 0.22%), Immigrants from Senegal (14.0%, a difference of 0.29%), and Immigrants from Caribbean (14.0%, a difference of 0.34%).
| Demographics | Rating | Rank | Male Poverty |
| Vietnamese | 0.0 /100 | #291 | Tragic 13.8% |
| Indonesians | 0.0 /100 | #292 | Tragic 13.8% |
| Immigrants | Belize | 0.0 /100 | #293 | Tragic 13.8% |
| Hispanics or Latinos | 0.0 /100 | #294 | Tragic 13.9% |
| Immigrants | Central America | 0.0 /100 | #295 | Tragic 13.9% |
| Cajuns | 0.0 /100 | #296 | Tragic 13.9% |
| Inupiat | 0.0 /100 | #297 | Tragic 14.0% |
| Blackfeet | 0.0 /100 | #298 | Tragic 14.0% |
| Immigrants | Guatemala | 0.0 /100 | #299 | Tragic 14.0% |
| Immigrants | Mexico | 0.0 /100 | #300 | Tragic 14.0% |
| Immigrants | Senegal | 0.0 /100 | #301 | Tragic 14.0% |
| Immigrants | Caribbean | 0.0 /100 | #302 | Tragic 14.0% |
| Bahamians | 0.0 /100 | #303 | Tragic 14.1% |
| Senegalese | 0.0 /100 | #304 | Tragic 14.1% |
| Immigrants | Bangladesh | 0.0 /100 | #305 | Tragic 14.1% |
Demographics Similar to Chickasaw by Male Poverty
In terms of male poverty, the demographic groups most similar to Chickasaw are Immigrants from West Indies (13.5%, a difference of 0.070%), Immigrants from Bahamas (13.5%, a difference of 0.29%), Barbadian (13.6%, a difference of 0.70%), Immigrants from Latin America (13.6%, a difference of 0.89%), and Bangladeshi (13.6%, a difference of 1.0%).
| Demographics | Rating | Rank | Male Poverty |
| Immigrants | Guyana | 0.1 /100 | #266 | Tragic 13.2% |
| Immigrants | Jamaica | 0.1 /100 | #267 | Tragic 13.3% |
| Sub-Saharan Africans | 0.1 /100 | #268 | Tragic 13.3% |
| Guyanese | 0.0 /100 | #269 | Tragic 13.3% |
| Cree | 0.0 /100 | #270 | Tragic 13.3% |
| Spanish Americans | 0.0 /100 | #271 | Tragic 13.4% |
| Immigrants | Bahamas | 0.0 /100 | #272 | Tragic 13.5% |
| Chickasaw | 0.0 /100 | #273 | Tragic 13.5% |
| Immigrants | West Indies | 0.0 /100 | #274 | Tragic 13.5% |
| Barbadians | 0.0 /100 | #275 | Tragic 13.6% |
| Immigrants | Latin America | 0.0 /100 | #276 | Tragic 13.6% |
| Bangladeshis | 0.0 /100 | #277 | Tragic 13.6% |
| Belizeans | 0.0 /100 | #278 | Tragic 13.6% |
| Haitians | 0.0 /100 | #279 | Tragic 13.7% |
| Mexicans | 0.0 /100 | #280 | Tragic 13.7% |