Belizean vs Chickasaw Family Poverty
COMPARE
Belizean
Chickasaw
Family Poverty
Family Poverty Comparison
Belizeans
Chickasaw
11.3%
FAMILY POVERTY
0.0/ 100
METRIC RATING
280th/ 347
METRIC RANK
10.8%
FAMILY POVERTY
0.2/ 100
METRIC RATING
256th/ 347
METRIC RANK
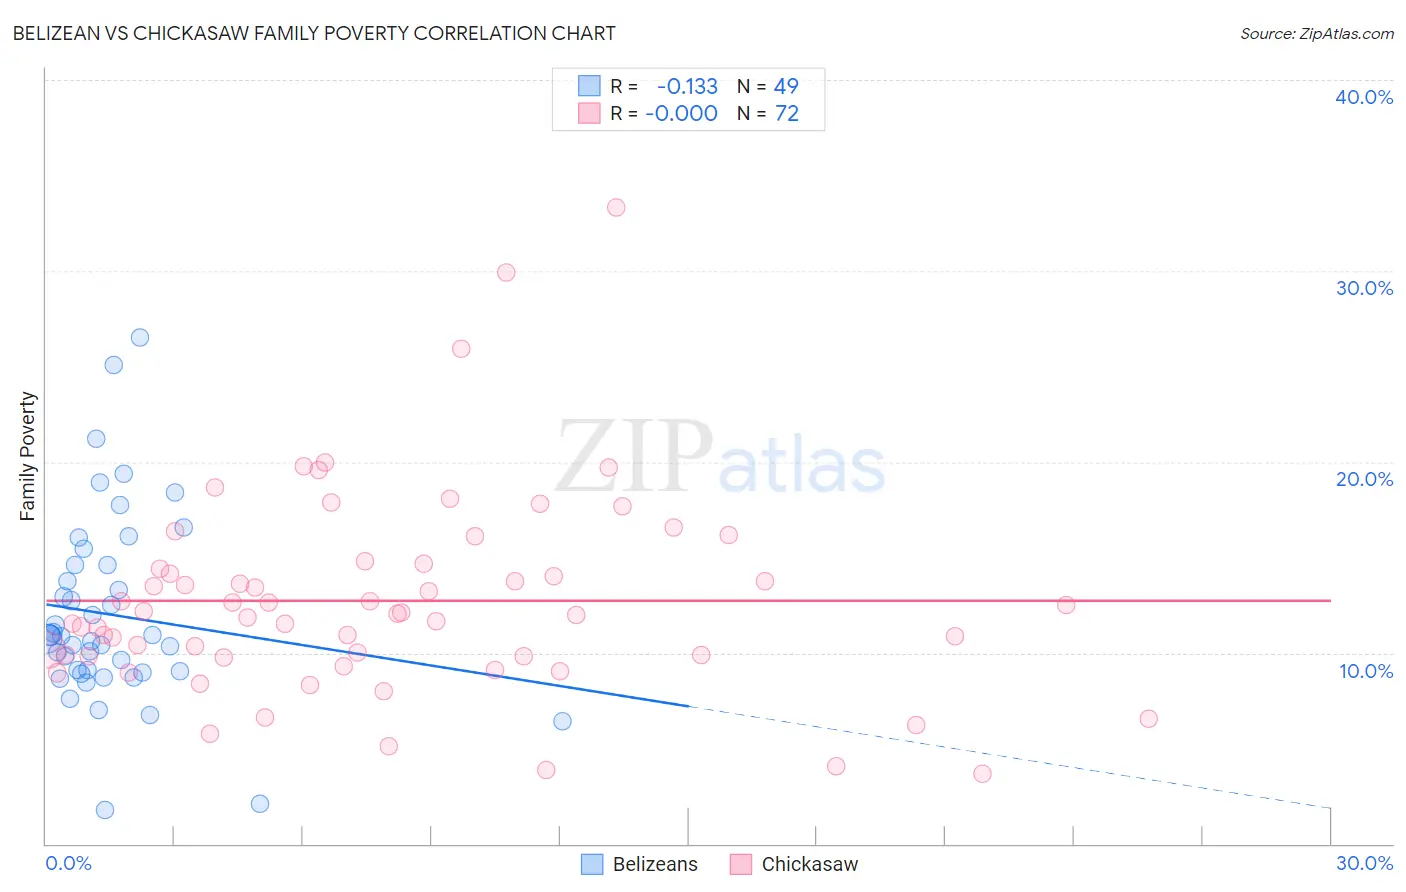
Belizean vs Chickasaw Family Poverty Correlation Chart
The statistical analysis conducted on geographies consisting of 144,106,447 people shows a poor negative correlation between the proportion of Belizeans and poverty level among families in the United States with a correlation coefficient (R) of -0.133 and weighted average of 11.3%. Similarly, the statistical analysis conducted on geographies consisting of 147,601,652 people shows no correlation between the proportion of Chickasaw and poverty level among families in the United States with a correlation coefficient (R) of -0.000 and weighted average of 10.8%, a difference of 3.8%.
Family Poverty Correlation Summary
| Measurement | Belizean | Chickasaw |
| Minimum | 1.8% | 3.7% |
| Maximum | 26.5% | 33.3% |
| Range | 24.7% | 29.7% |
| Mean | 12.0% | 12.7% |
| Median | 10.8% | 12.0% |
| Interquartile 25% (IQ1) | 9.0% | 9.8% |
| Interquartile 75% (IQ3) | 14.6% | 14.5% |
| Interquartile Range (IQR) | 5.6% | 4.7% |
| Standard Deviation (Sample) | 4.9% | 5.3% |
| Standard Deviation (Population) | 4.9% | 5.2% |
Similar Demographics by Family Poverty
Demographics Similar to Belizeans by Family Poverty
In terms of family poverty, the demographic groups most similar to Belizeans are Blackfeet (11.3%, a difference of 0.040%), Guyanese (11.2%, a difference of 0.18%), Chippewa (11.2%, a difference of 0.21%), Immigrants from West Indies (11.3%, a difference of 0.27%), and Immigrants from Guyana (11.2%, a difference of 0.30%).
| Demographics | Rating | Rank | Family Poverty |
| Somalis | 0.1 /100 | #273 | Tragic 11.2% |
| Spanish Americans | 0.1 /100 | #274 | Tragic 11.2% |
| Central Americans | 0.1 /100 | #275 | Tragic 11.2% |
| Immigrants | Guyana | 0.1 /100 | #276 | Tragic 11.2% |
| Chippewa | 0.1 /100 | #277 | Tragic 11.2% |
| Guyanese | 0.1 /100 | #278 | Tragic 11.2% |
| Blackfeet | 0.0 /100 | #279 | Tragic 11.3% |
| Belizeans | 0.0 /100 | #280 | Tragic 11.3% |
| Immigrants | West Indies | 0.0 /100 | #281 | Tragic 11.3% |
| Immigrants | Cuba | 0.0 /100 | #282 | Tragic 11.3% |
| Indonesians | 0.0 /100 | #283 | Tragic 11.3% |
| Yaqui | 0.0 /100 | #284 | Tragic 11.3% |
| Barbadians | 0.0 /100 | #285 | Tragic 11.3% |
| Senegalese | 0.0 /100 | #286 | Tragic 11.5% |
| Vietnamese | 0.0 /100 | #287 | Tragic 11.5% |
Demographics Similar to Chickasaw by Family Poverty
In terms of family poverty, the demographic groups most similar to Chickasaw are Immigrants from Ghana (10.8%, a difference of 0.040%), Subsaharan African (10.9%, a difference of 0.070%), Mexican American Indian (10.9%, a difference of 0.11%), Immigrants from Liberia (10.8%, a difference of 0.26%), and Bangladeshi (10.9%, a difference of 0.46%).
| Demographics | Rating | Rank | Family Poverty |
| Cubans | 0.4 /100 | #249 | Tragic 10.6% |
| Salvadorans | 0.3 /100 | #250 | Tragic 10.7% |
| Iroquois | 0.3 /100 | #251 | Tragic 10.7% |
| Immigrants | Zaire | 0.3 /100 | #252 | Tragic 10.7% |
| Immigrants | Western Africa | 0.3 /100 | #253 | Tragic 10.7% |
| Ecuadorians | 0.2 /100 | #254 | Tragic 10.8% |
| Immigrants | Liberia | 0.2 /100 | #255 | Tragic 10.8% |
| Chickasaw | 0.2 /100 | #256 | Tragic 10.8% |
| Immigrants | Ghana | 0.2 /100 | #257 | Tragic 10.8% |
| Sub-Saharan Africans | 0.2 /100 | #258 | Tragic 10.9% |
| Mexican American Indians | 0.2 /100 | #259 | Tragic 10.9% |
| Bangladeshis | 0.2 /100 | #260 | Tragic 10.9% |
| Shoshone | 0.2 /100 | #261 | Tragic 10.9% |
| Spanish American Indians | 0.2 /100 | #262 | Tragic 10.9% |
| Cape Verdeans | 0.1 /100 | #263 | Tragic 10.9% |