Belgian vs Maltese Married-Couple Family Poverty

COMPARE

Belgian
Race
Ancestry
AfghanAfricanAlaska NativeAlaskan AthabascanAlbanianAleutAlsatianAmericanApacheArabArapahoArgentineanArmenianAssyrian/Chaldean/SyriacAustralianAustrianBahamianBangladeshiBarbadianBasqueBelgianBelizeanBermudanBhutaneseBlackfeetBolivianBrazilianBritishBritish West IndianBulgarianBurmeseCajunCambodianCanadianCape VerdeanCarpatho RusynCelticCentral AmericanCentral American IndianCherokeeCheyenneChickasawChileanChineseChippewaChoctawColombianColvilleComancheCosta RicanCreeCreekCroatianCrowCubanCypriotCzechCzechoslovakianDanishDelawareDominicanDutchDutch West IndianEastern EuropeanEcuadorianEgyptianEnglishEstonianEthiopianEuropeanFijianFilipinoFinnishFrenchFrench American IndianFrench CanadianGermanGerman RussianGhanaianGreekGuamanian/ChamorroGuatemalanGuyaneseHaitianHmongHonduranHopiHoumaHungarianIcelanderIndian (Asian)IndonesianInupiatIranianIraqiIrishIroquoisIsraeliItalianJamaicanJapaneseJordanianKenyanKiowaKoreanLaotianLatvianLebaneseLiberianLithuanianLumbeeLuxembourgerMacedonianMalaysianMarshalleseMenomineeMexicanMexican American IndianMongolianMoroccanNative HawaiianNavajoNepaleseNew ZealanderNicaraguanNigerianNorthern EuropeanNorwegianOkinawanOsageOttawaPaiutePakistaniPalestinianPanamanianParaguayanPennsylvania GermanPeruvianPimaPolishPortuguesePotawatomiPuebloPuerto RicanPuget Sound SalishRomanianRussianSalvadoranSamoanScandinavianScotch-IrishScottishSeminoleSenegaleseSerbianShoshoneSierra LeoneanSiouxSlavicSlovakSloveneSomaliSouth AfricanSouth AmericanSouth American IndianSoviet UnionSpaniardSpanishSpanish AmericanSpanish American IndianSri LankanSubsaharan AfricanSudaneseSwedishSwissSyrianTaiwaneseThaiTlingit-HaidaTohono O'OdhamTonganTrinidadian and TobagonianTsimshianTurkishU.S. Virgin IslanderUgandanUkrainianUruguayanUteVenezuelanVietnameseWelshWest IndianYakamaYaquiYugoslavianYumanYup'ikZimbabwean
Immigration
NonimmigrantsImmigrantsAfghanistanAfricaAlbaniaArgentinaArmeniaAsiaAustraliaAustriaBahamasBangladeshBarbadosBelarusBelgiumBelizeBoliviaBosnia and HerzegovinaBrazilBulgariaBurma/MyanmarCabo VerdeCambodiaCameroonCanadaCaribbeanCentral AmericaChileChinaColombiaCongoCosta RicaCroatiaCubaCzechoslovakiaDenmarkDominicaDominican RepublicEastern AfricaEastern AsiaEastern EuropeEcuadorEgyptEl SalvadorEnglandEritreaEthiopiaEuropeFijiFranceGermanyGhanaGreeceGrenadaGuatemalaGuyanaHaitiHondurasHong KongHungaryIndiaIndonesiaIranIraqIrelandIsraelItalyJamaicaJapanJordanKazakhstanKenyaKoreaKuwaitLaosLatin AmericaLatviaLebanonLiberiaLithuaniaMalaysiaMexicoMicronesiaMiddle AfricaMoldovaMoroccoNepalNetherlandsNicaraguaNigeriaNorth AmericaNorth MacedoniaNorthern AfricaNorthern EuropeNorwayOceaniaPakistanPanamaPeruPhilippinesPolandPortugalRomaniaRussiaSaudi ArabiaScotlandSenegalSerbiaSierra LeoneSingaporeSomaliaSouth AfricaSouth AmericaSouth Central AsiaSouth Eastern AsiaSouthern EuropeSpainSri LankaSt. Vincent and the GrenadinesSudanSwedenSwitzerlandSyriaTaiwanThailandTrinidad and TobagoTurkeyUgandaUkraineUruguayUzbekistanVenezuelaVietnamWest IndiesWestern AfricaWestern AsiaWestern EuropeYemenZaireZimbabweAzores
Maltese
Race
Ancestry
AfghanAfricanAlaska NativeAlaskan AthabascanAlbanianAleutAlsatianAmericanApacheArabArapahoArgentineanArmenianAssyrian/Chaldean/SyriacAustralianAustrianBahamianBangladeshiBarbadianBasqueBelizeanBermudanBhutaneseBlackfeetBolivianBrazilianBritishBritish West IndianBulgarianBurmeseCajunCambodianCanadianCape VerdeanCarpatho RusynCelticCentral AmericanCentral American IndianCherokeeCheyenneChickasawChileanChineseChippewaChoctawColombianColvilleComancheCosta RicanCreeCreekCroatianCrowCubanCypriotCzechCzechoslovakianDanishDelawareDominicanDutchDutch West IndianEastern EuropeanEcuadorianEgyptianEnglishEstonianEthiopianEuropeanFijianFilipinoFinnishFrenchFrench American IndianFrench CanadianGermanGerman RussianGhanaianGreekGuamanian/ChamorroGuatemalanGuyaneseHaitianHmongHonduranHopiHoumaHungarianIcelanderIndian (Asian)IndonesianInupiatIranianIraqiIrishIroquoisIsraeliItalianJamaicanJapaneseJordanianKenyanKiowaKoreanLaotianLatvianLebaneseLiberianLithuanianLumbeeLuxembourgerMacedonianMalaysianMalteseMarshalleseMenomineeMexicanMexican American IndianMongolianMoroccanNative HawaiianNavajoNepaleseNew ZealanderNicaraguanNigerianNorthern EuropeanNorwegianOkinawanOsageOttawaPaiutePakistaniPalestinianPanamanianParaguayanPennsylvania GermanPeruvianPimaPolishPortuguesePotawatomiPuebloPuerto RicanPuget Sound SalishRomanianRussianSalvadoranSamoanScandinavianScotch-IrishScottishSeminoleSenegaleseSerbianShoshoneSierra LeoneanSiouxSlavicSlovakSloveneSomaliSouth AfricanSouth AmericanSouth American IndianSoviet UnionSpaniardSpanishSpanish AmericanSpanish American IndianSri LankanSubsaharan AfricanSudaneseSwedishSwissSyrianTaiwaneseThaiTlingit-HaidaTohono O'OdhamTonganTrinidadian and TobagonianTsimshianTurkishU.S. Virgin IslanderUgandanUkrainianUruguayanUteVenezuelanVietnameseWelshWest IndianYakamaYaquiYugoslavianYumanYup'ikZimbabwean
Immigration
NonimmigrantsImmigrantsAfghanistanAfricaAlbaniaArgentinaArmeniaAsiaAustraliaAustriaBahamasBangladeshBarbadosBelarusBelgiumBelizeBoliviaBosnia and HerzegovinaBrazilBulgariaBurma/MyanmarCabo VerdeCambodiaCameroonCanadaCaribbeanCentral AmericaChileChinaColombiaCongoCosta RicaCroatiaCubaCzechoslovakiaDenmarkDominicaDominican RepublicEastern AfricaEastern AsiaEastern EuropeEcuadorEgyptEl SalvadorEnglandEritreaEthiopiaEuropeFijiFranceGermanyGhanaGreeceGrenadaGuatemalaGuyanaHaitiHondurasHong KongHungaryIndiaIndonesiaIranIraqIrelandIsraelItalyJamaicaJapanJordanKazakhstanKenyaKoreaKuwaitLaosLatin AmericaLatviaLebanonLiberiaLithuaniaMalaysiaMexicoMicronesiaMiddle AfricaMoldovaMoroccoNepalNetherlandsNicaraguaNigeriaNorth AmericaNorth MacedoniaNorthern AfricaNorthern EuropeNorwayOceaniaPakistanPanamaPeruPhilippinesPolandPortugalRomaniaRussiaSaudi ArabiaScotlandSenegalSerbiaSierra LeoneSingaporeSomaliaSouth AfricaSouth AmericaSouth Central AsiaSouth Eastern AsiaSouthern EuropeSpainSri LankaSt. Vincent and the GrenadinesSudanSwedenSwitzerlandSyriaTaiwanThailandTrinidad and TobagoTurkeyUgandaUkraineUruguayUzbekistanVenezuelaVietnamWest IndiesWestern AfricaWestern AsiaWestern EuropeYemenZaireZimbabweAzores
Married-Couple Family Poverty
Income
Poverty
Unemployment
Labor Participation
Family Structure
Vehicle Availability
Education Level
Disability

Married-Couple Family Poverty Comparison

Belgians

Maltese

Exceptional
Exceptional
4.2%
MARRIED-COUPLE FAMILY POVERTY
99.9/ 100
METRIC RATING
38th/ 347
METRIC RANK
4.1%
MARRIED-COUPLE FAMILY POVERTY
99.9/ 100
METRIC RATING
20th/ 347
METRIC RANK

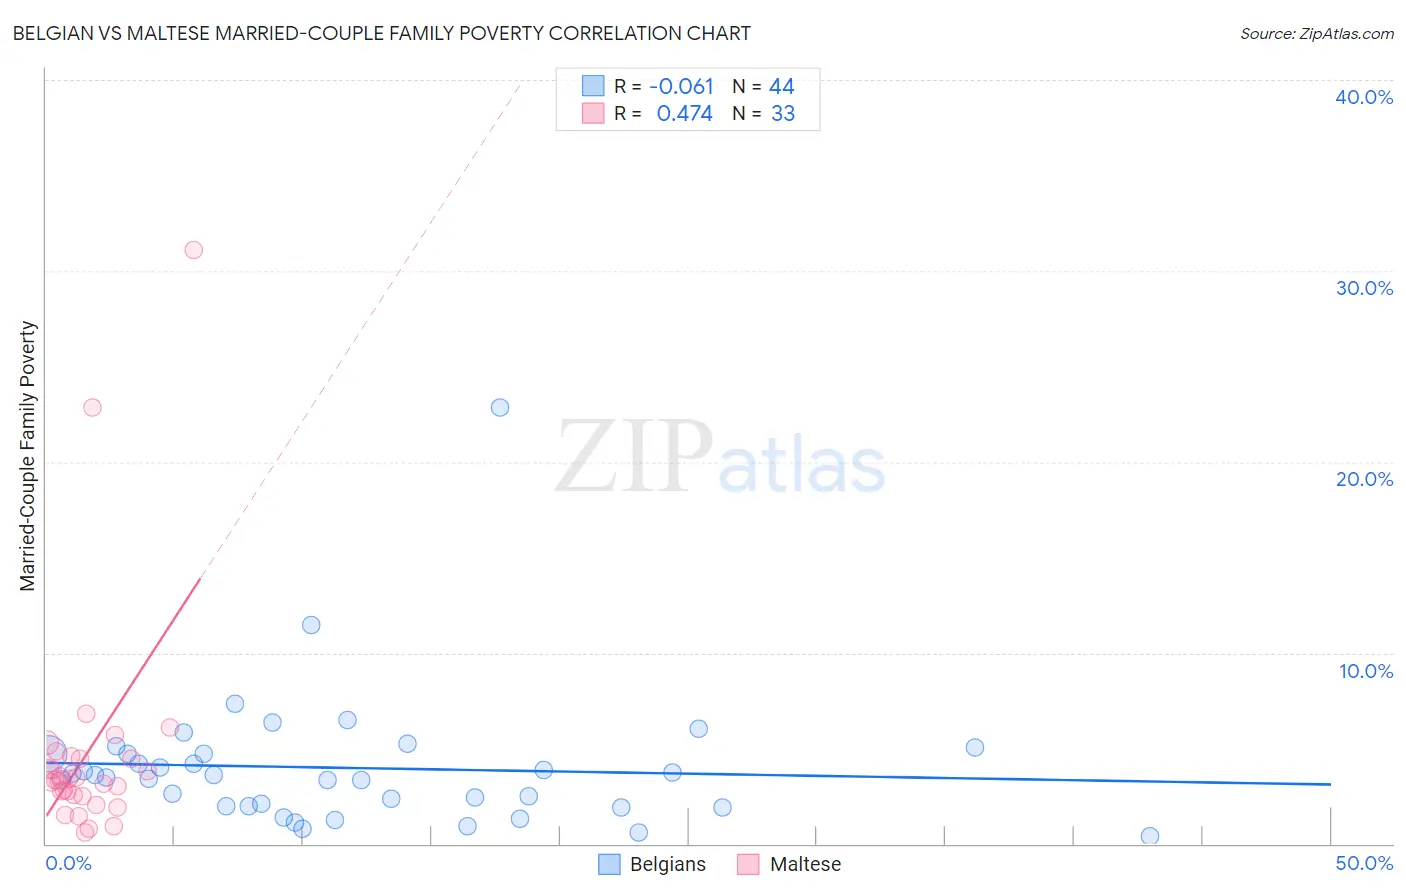
Belgian vs Maltese Married-Couple Family Poverty Correlation Chart

The statistical analysis conducted on geographies consisting of 352,443,017 people shows a slight negative correlation between the proportion of Belgians and poverty level among married-couple families in the United States with a correlation coefficient (R) of -0.061 and weighted average of 4.2%. Similarly, the statistical analysis conducted on geographies consisting of 125,965,353 people shows a moderate positive correlation between the proportion of Maltese and poverty level among married-couple families in the United States with a correlation coefficient (R) of 0.474 and weighted average of 4.1%, a difference of 3.7%.
Belgian vs Maltese Married-Couple Family Poverty

Married-Couple Family Poverty Correlation Summary

MeasurementBelgianMaltese
Minimum0.38%0.56%
Maximum22.9%31.1%
Range22.5%30.6%
Mean4.0%4.7%
Median3.5%3.3%
Interquartile 25% (IQ1)2.0%2.5%
Interquartile 75% (IQ3)4.7%4.5%
Interquartile Range (IQR)2.7%2.0%
Standard Deviation (Sample)3.6%6.0%
Standard Deviation (Population)3.5%5.9%

Demographics Similar to Belgians and Maltese by Married-Couple Family Poverty

In terms of married-couple family poverty, the demographic groups most similar to Belgians are Iranian (4.2%, a difference of 0.12%), Immigrants from Northern Europe (4.2%, a difference of 0.13%), English (4.2%, a difference of 0.19%), European (4.2%, a difference of 0.22%), and Dutch (4.2%, a difference of 0.80%). Similarly, the demographic groups most similar to Maltese are Zimbabwean (4.1%, a difference of 0.030%), Immigrants from Ireland (4.1%, a difference of 0.25%), Immigrants from Singapore (4.1%, a difference of 0.40%), Bhutanese (4.1%, a difference of 0.42%), and Eastern European (4.1%, a difference of 0.65%).
DemographicsRating | RankMarried-Couple Family Poverty
Immigrants | Ireland
99.9
/100
|
#19
Exceptional
4.1%
Maltese
99.9
/100
|
#20
Exceptional
4.1%
Zimbabweans
99.9
/100
|
#21
Exceptional
4.1%
Immigrants | Singapore
99.9
/100
|
#22
Exceptional
4.1%
Bhutanese
99.9
/100
|
#23
Exceptional
4.1%
Eastern Europeans
99.9
/100
|
#24
Exceptional
4.1%
Immigrants | Taiwan
99.9
/100
|
#25
Exceptional
4.1%
Cypriots
99.9
/100
|
#26
Exceptional
4.1%
Danes
99.9
/100
|
#27
Exceptional
4.1%
Scandinavians
99.9
/100
|
#28
Exceptional
4.1%
Immigrants | Scotland
99.9
/100
|
#29
Exceptional
4.2%
Finns
99.9
/100
|
#30
Exceptional
4.2%
Estonians
99.9
/100
|
#31
Exceptional
4.2%
Greeks
99.9
/100
|
#32
Exceptional
4.2%
Irish
99.9
/100
|
#33
Exceptional
4.2%
Dutch
99.9
/100
|
#34
Exceptional
4.2%
Europeans
99.9
/100
|
#35
Exceptional
4.2%
English
99.9
/100
|
#36
Exceptional
4.2%
Iranians
99.9
/100
|
#37
Exceptional
4.2%
Belgians
99.9
/100
|
#38
Exceptional
4.2%
Immigrants | Northern Europe
99.8
/100
|
#39
Exceptional
4.2%