Albanian vs Ukrainian Child Poverty Among Girls Under 16

COMPARE

Albanian
Race
Ancestry
AfghanAfricanAlaska NativeAlaskan AthabascanAlbanianAleutAlsatianAmericanApacheArabArapahoArgentineanArmenianAssyrian/Chaldean/SyriacAustralianAustrianBahamianBangladeshiBarbadianBasqueBelgianBelizeanBermudanBhutaneseBlackfeetBolivianBrazilianBritishBritish West IndianBulgarianBurmeseCajunCambodianCanadianCape VerdeanCarpatho RusynCelticCentral AmericanCentral American IndianCherokeeCheyenneChickasawChileanChineseChippewaChoctawColombianColvilleComancheCosta RicanCreeCreekCroatianCrowCubanCypriotCzechCzechoslovakianDanishDelawareDominicanDutchDutch West IndianEastern EuropeanEcuadorianEgyptianEnglishEstonianEthiopianEuropeanFijianFilipinoFinnishFrenchFrench American IndianFrench CanadianGermanGerman RussianGhanaianGreekGuamanian/ChamorroGuatemalanGuyaneseHaitianHmongHonduranHopiHoumaHungarianIcelanderIndian (Asian)IndonesianInupiatIranianIraqiIrishIroquoisIsraeliItalianJamaicanJapaneseJordanianKenyanKiowaKoreanLaotianLatvianLebaneseLiberianLithuanianLumbeeLuxembourgerMacedonianMalaysianMalteseMarshalleseMenomineeMexicanMexican American IndianMongolianMoroccanNative HawaiianNavajoNepaleseNew ZealanderNicaraguanNigerianNorthern EuropeanNorwegianOkinawanOsageOttawaPaiutePakistaniPalestinianPanamanianParaguayanPennsylvania GermanPeruvianPimaPolishPortuguesePotawatomiPuebloPuerto RicanPuget Sound SalishRomanianRussianSalvadoranSamoanScandinavianScotch-IrishScottishSeminoleSenegaleseSerbianShoshoneSierra LeoneanSiouxSlavicSlovakSloveneSomaliSouth AfricanSouth AmericanSouth American IndianSoviet UnionSpaniardSpanishSpanish AmericanSpanish American IndianSri LankanSubsaharan AfricanSudaneseSwedishSwissSyrianTaiwaneseThaiTlingit-HaidaTohono O'OdhamTonganTrinidadian and TobagonianTsimshianTurkishU.S. Virgin IslanderUgandanUruguayanUteVenezuelanVietnameseWelshWest IndianYakamaYaquiYugoslavianYumanYup'ikZimbabwean
Immigration
NonimmigrantsImmigrantsAfghanistanAfricaAlbaniaArgentinaArmeniaAsiaAustraliaAustriaBahamasBangladeshBarbadosBelarusBelgiumBelizeBoliviaBosnia and HerzegovinaBrazilBulgariaBurma/MyanmarCabo VerdeCambodiaCameroonCanadaCaribbeanCentral AmericaChileChinaColombiaCongoCosta RicaCroatiaCubaCzechoslovakiaDenmarkDominicaDominican RepublicEastern AfricaEastern AsiaEastern EuropeEcuadorEgyptEl SalvadorEnglandEritreaEthiopiaEuropeFijiFranceGermanyGhanaGreeceGrenadaGuatemalaGuyanaHaitiHondurasHong KongHungaryIndiaIndonesiaIranIraqIrelandIsraelItalyJamaicaJapanJordanKazakhstanKenyaKoreaKuwaitLaosLatin AmericaLatviaLebanonLiberiaLithuaniaMalaysiaMexicoMicronesiaMiddle AfricaMoldovaMoroccoNepalNetherlandsNicaraguaNigeriaNorth AmericaNorth MacedoniaNorthern AfricaNorthern EuropeNorwayOceaniaPakistanPanamaPeruPhilippinesPolandPortugalRomaniaRussiaSaudi ArabiaScotlandSenegalSerbiaSierra LeoneSingaporeSomaliaSouth AfricaSouth AmericaSouth Central AsiaSouth Eastern AsiaSouthern EuropeSpainSri LankaSt. Vincent and the GrenadinesSudanSwedenSwitzerlandSyriaTaiwanThailandTrinidad and TobagoTurkeyUgandaUkraineUruguayUzbekistanVenezuelaVietnamWest IndiesWestern AfricaWestern AsiaWestern EuropeYemenZaireZimbabweAzores
Ukrainian
Race
Ancestry
AfghanAfricanAlaska NativeAlaskan AthabascanAleutAlsatianAmericanApacheArabArapahoArgentineanArmenianAssyrian/Chaldean/SyriacAustralianAustrianBahamianBangladeshiBarbadianBasqueBelgianBelizeanBermudanBhutaneseBlackfeetBolivianBrazilianBritishBritish West IndianBulgarianBurmeseCajunCambodianCanadianCape VerdeanCarpatho RusynCelticCentral AmericanCentral American IndianCherokeeCheyenneChickasawChileanChineseChippewaChoctawColombianColvilleComancheCosta RicanCreeCreekCroatianCrowCubanCypriotCzechCzechoslovakianDanishDelawareDominicanDutchDutch West IndianEastern EuropeanEcuadorianEgyptianEnglishEstonianEthiopianEuropeanFijianFilipinoFinnishFrenchFrench American IndianFrench CanadianGermanGerman RussianGhanaianGreekGuamanian/ChamorroGuatemalanGuyaneseHaitianHmongHonduranHopiHoumaHungarianIcelanderIndian (Asian)IndonesianInupiatIranianIraqiIrishIroquoisIsraeliItalianJamaicanJapaneseJordanianKenyanKiowaKoreanLaotianLatvianLebaneseLiberianLithuanianLumbeeLuxembourgerMacedonianMalaysianMalteseMarshalleseMenomineeMexicanMexican American IndianMongolianMoroccanNative HawaiianNavajoNepaleseNew ZealanderNicaraguanNigerianNorthern EuropeanNorwegianOkinawanOsageOttawaPaiutePakistaniPalestinianPanamanianParaguayanPennsylvania GermanPeruvianPimaPolishPortuguesePotawatomiPuebloPuerto RicanPuget Sound SalishRomanianRussianSalvadoranSamoanScandinavianScotch-IrishScottishSeminoleSenegaleseSerbianShoshoneSierra LeoneanSiouxSlavicSlovakSloveneSomaliSouth AfricanSouth AmericanSouth American IndianSoviet UnionSpaniardSpanishSpanish AmericanSpanish American IndianSri LankanSubsaharan AfricanSudaneseSwedishSwissSyrianTaiwaneseThaiTlingit-HaidaTohono O'OdhamTonganTrinidadian and TobagonianTsimshianTurkishU.S. Virgin IslanderUgandanUkrainianUruguayanUteVenezuelanVietnameseWelshWest IndianYakamaYaquiYugoslavianYumanYup'ikZimbabwean
Immigration
NonimmigrantsImmigrantsAfghanistanAfricaAlbaniaArgentinaArmeniaAsiaAustraliaAustriaBahamasBangladeshBarbadosBelarusBelgiumBelizeBoliviaBosnia and HerzegovinaBrazilBulgariaBurma/MyanmarCabo VerdeCambodiaCameroonCanadaCaribbeanCentral AmericaChileChinaColombiaCongoCosta RicaCroatiaCubaCzechoslovakiaDenmarkDominicaDominican RepublicEastern AfricaEastern AsiaEastern EuropeEcuadorEgyptEl SalvadorEnglandEritreaEthiopiaEuropeFijiFranceGermanyGhanaGreeceGrenadaGuatemalaGuyanaHaitiHondurasHong KongHungaryIndiaIndonesiaIranIraqIrelandIsraelItalyJamaicaJapanJordanKazakhstanKenyaKoreaKuwaitLaosLatin AmericaLatviaLebanonLiberiaLithuaniaMalaysiaMexicoMicronesiaMiddle AfricaMoldovaMoroccoNepalNetherlandsNicaraguaNigeriaNorth AmericaNorth MacedoniaNorthern AfricaNorthern EuropeNorwayOceaniaPakistanPanamaPeruPhilippinesPolandPortugalRomaniaRussiaSaudi ArabiaScotlandSenegalSerbiaSierra LeoneSingaporeSomaliaSouth AfricaSouth AmericaSouth Central AsiaSouth Eastern AsiaSouthern EuropeSpainSri LankaSt. Vincent and the GrenadinesSudanSwedenSwitzerlandSyriaTaiwanThailandTrinidad and TobagoTurkeyUgandaUkraineUruguayUzbekistanVenezuelaVietnamWest IndiesWestern AfricaWestern AsiaWestern EuropeYemenZaireZimbabweAzores
Child Poverty Among Girls Under 16
Income
Poverty
Unemployment
Labor Participation
Family Structure
Vehicle Availability
Education Level
Disability

Child Poverty Among Girls Under 16 Comparison

Albanians

Ukrainians

Exceptional
Exceptional
15.4%
CHILD POVERTY AMONG GIRLS UNDER 16
90.5/ 100
METRIC RATING
128th/ 347
METRIC RANK
14.7%
CHILD POVERTY AMONG GIRLS UNDER 16
97.7/ 100
METRIC RATING
81st/ 347
METRIC RANK

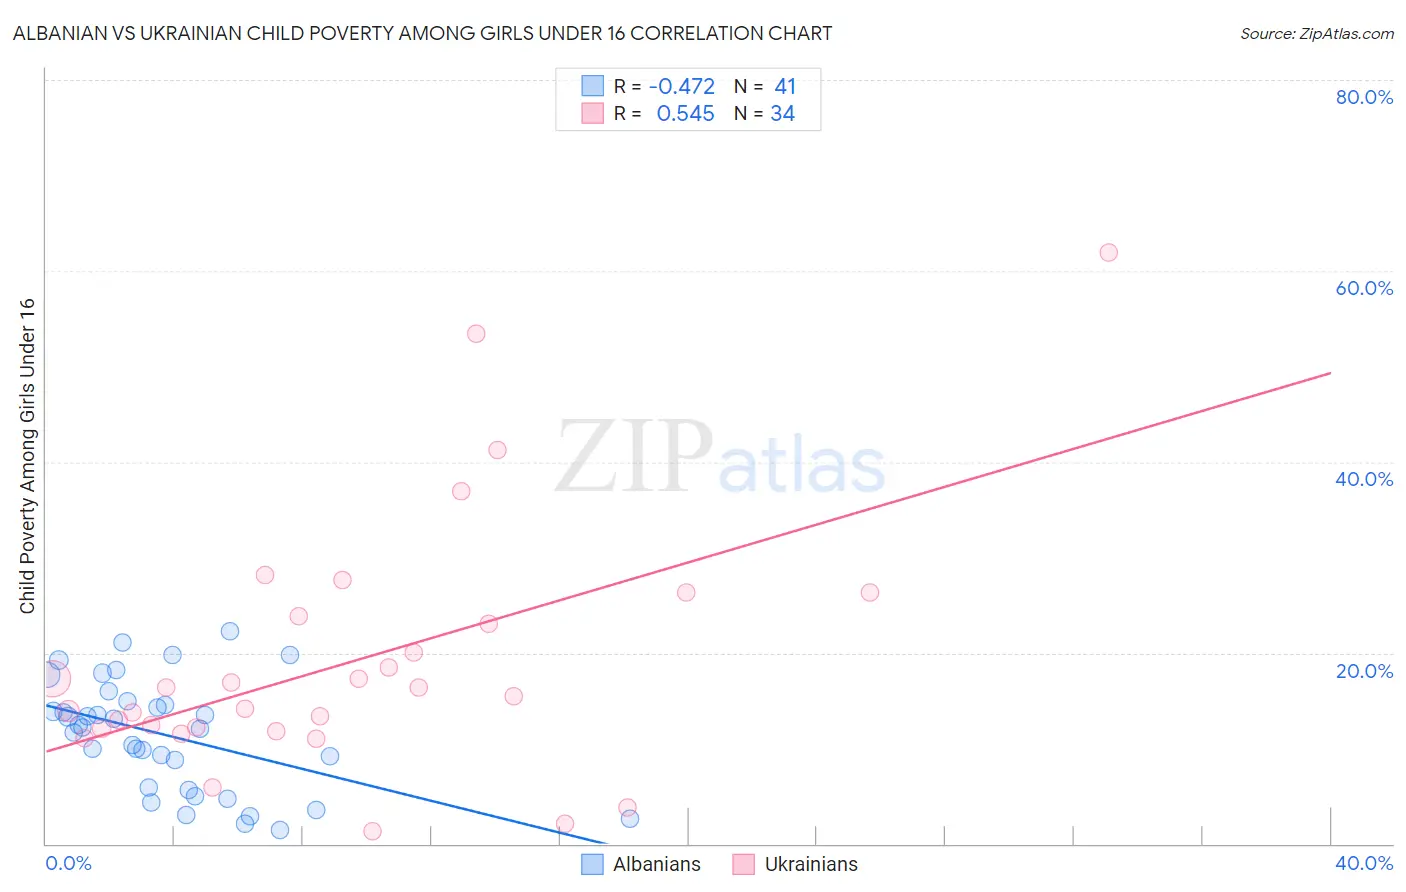
Albanian vs Ukrainian Child Poverty Among Girls Under 16 Correlation Chart

The statistical analysis conducted on geographies consisting of 190,280,277 people shows a moderate negative correlation between the proportion of Albanians and poverty level among girls under the age of 16 in the United States with a correlation coefficient (R) of -0.472 and weighted average of 15.4%. Similarly, the statistical analysis conducted on geographies consisting of 435,732,130 people shows a substantial positive correlation between the proportion of Ukrainians and poverty level among girls under the age of 16 in the United States with a correlation coefficient (R) of 0.545 and weighted average of 14.7%, a difference of 4.9%.
Albanian vs Ukrainian Child Poverty Among Girls Under 16

Child Poverty Among Girls Under 16 Correlation Summary

MeasurementAlbanianUkrainian
Minimum1.4%1.3%
Maximum22.2%61.9%
Range20.8%60.6%
Mean11.4%19.1%
Median12.2%15.9%
Interquartile 25% (IQ1)5.8%12.1%
Interquartile 75% (IQ3)14.7%23.9%
Interquartile Range (IQR)9.0%11.8%
Standard Deviation (Sample)5.7%13.2%
Standard Deviation (Population)5.7%13.0%

Similar Demographics by Child Poverty Among Girls Under 16

Demographics Similar to Albanians by Child Poverty Among Girls Under 16

In terms of child poverty among girls under 16, the demographic groups most similar to Albanians are Immigrants from South Eastern Asia (15.4%, a difference of 0.010%), Immigrants from Norway (15.4%, a difference of 0.090%), Scottish (15.4%, a difference of 0.16%), Puget Sound Salish (15.4%, a difference of 0.17%), and Immigrants from Western Europe (15.4%, a difference of 0.19%).
DemographicsRating | RankChild Poverty Among Girls Under 16
English
92.2
/100
|
#121
Exceptional
15.3%
Portuguese
91.8
/100
|
#122
Exceptional
15.3%
Irish
91.5
/100
|
#123
Exceptional
15.3%
Carpatho Rusyns
91.4
/100
|
#124
Exceptional
15.3%
Peruvians
91.2
/100
|
#125
Exceptional
15.4%
Scottish
91.0
/100
|
#126
Exceptional
15.4%
Immigrants | Norway
90.8
/100
|
#127
Exceptional
15.4%
Albanians
90.5
/100
|
#128
Exceptional
15.4%
Immigrants | South Eastern Asia
90.5
/100
|
#129
Exceptional
15.4%
Puget Sound Salish
90.1
/100
|
#130
Exceptional
15.4%
Immigrants | Western Europe
90.0
/100
|
#131
Exceptional
15.4%
Mongolians
89.7
/100
|
#132
Excellent
15.4%
Brazilians
89.6
/100
|
#133
Excellent
15.4%
Immigrants | Spain
89.1
/100
|
#134
Excellent
15.5%
Czechoslovakians
89.0
/100
|
#135
Excellent
15.5%

Demographics Similar to Ukrainians by Child Poverty Among Girls Under 16

In terms of child poverty among girls under 16, the demographic groups most similar to Ukrainians are Immigrants from Turkey (14.7%, a difference of 0.19%), Egyptian (14.7%, a difference of 0.19%), Argentinean (14.7%, a difference of 0.21%), Tlingit-Haida (14.7%, a difference of 0.22%), and Immigrants from Russia (14.7%, a difference of 0.23%).
DemographicsRating | RankChild Poverty Among Girls Under 16
Taiwanese
98.0
/100
|
#74
Exceptional
14.6%
Immigrants | Eastern Europe
98.0
/100
|
#75
Exceptional
14.6%
Immigrants | Russia
97.9
/100
|
#76
Exceptional
14.7%
Tlingit-Haida
97.9
/100
|
#77
Exceptional
14.7%
Argentineans
97.9
/100
|
#78
Exceptional
14.7%
Immigrants | Turkey
97.9
/100
|
#79
Exceptional
14.7%
Egyptians
97.9
/100
|
#80
Exceptional
14.7%
Ukrainians
97.7
/100
|
#81
Exceptional
14.7%
Macedonians
97.6
/100
|
#82
Exceptional
14.7%
Immigrants | Italy
97.4
/100
|
#83
Exceptional
14.8%
Soviet Union
97.3
/100
|
#84
Exceptional
14.8%
Swiss
97.2
/100
|
#85
Exceptional
14.8%
Australians
97.2
/100
|
#86
Exceptional
14.8%
Finns
97.2
/100
|
#87
Exceptional
14.8%
Immigrants | Canada
97.1
/100
|
#88
Exceptional
14.8%