Zip Codes with the Highest Percentage of Population Employed in Security & Protection in Salem, OR
RELATED REPORTS & OPTIONS
Security & Protection
Salem
Compare Zip Codes
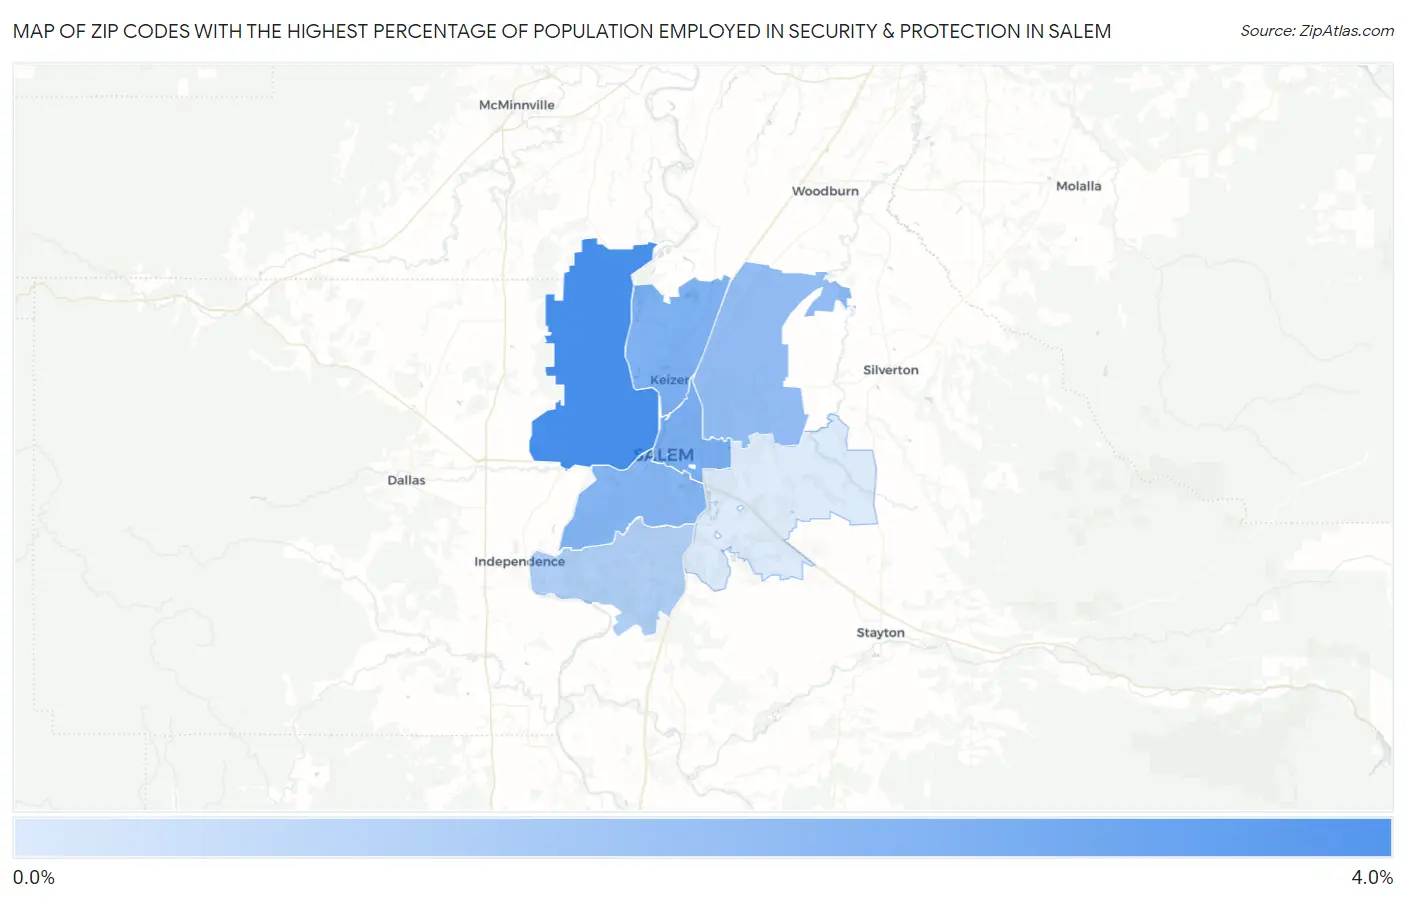
Map of Zip Codes with the Highest Percentage of Population Employed in Security & Protection in Salem
0.0%
4.0%
Zip Codes with the Highest Percentage of Population Employed in Security & Protection in Salem, OR
| Zip Code | % Employed | vs State | vs National | |
| 1. | 97304 | 3.1% | 1.7%(+1.46)#83 | 2.1%(+0.964)#6,848 |
| 2. | 97301 | 2.3% | 1.7%(+0.653)#112 | 2.1%(+0.159)#10,605 |
| 3. | 97303 | 2.2% | 1.7%(+0.566)#121 | 2.1%(+0.071)#11,136 |
| 4. | 97302 | 2.1% | 1.7%(+0.458)#125 | 2.1%(-0.036)#11,823 |
| 5. | 97305 | 1.9% | 1.7%(+0.283)#139 | 2.1%(-0.212)#12,973 |
| 6. | 97306 | 1.5% | 1.7%(-0.189)#194 | 2.1%(-0.683)#16,450 |
| 7. | 97317 | 0.76% | 1.7%(-0.895)#251 | 2.1%(-1.39)#21,662 |
1
Common Questions
What are the Top 5 Zip Codes with the Highest Percentage of Population Employed in Security & Protection in Salem, OR?
Top 5 Zip Codes with the Highest Percentage of Population Employed in Security & Protection in Salem, OR are:
What zip code has the Highest Percentage of Population Employed in Security & Protection in Salem, OR?
97304 has the Highest Percentage of Population Employed in Security & Protection in Salem, OR with 3.1%.
What is the Percentage of Population Employed in Security & Protection in Salem, OR?
Percentage of Population Employed in Security & Protection in Salem is 2.2%.
What is the Percentage of Population Employed in Security & Protection in Oregon?
Percentage of Population Employed in Security & Protection in Oregon is 1.7%.
What is the Percentage of Population Employed in Security & Protection in the United States?
Percentage of Population Employed in Security & Protection in the United States is 2.1%.