Zip Codes with the Highest Percentage of Population Employed in Security & Protection in Gresham, OR
RELATED REPORTS & OPTIONS
Security & Protection
Gresham
Compare Zip Codes
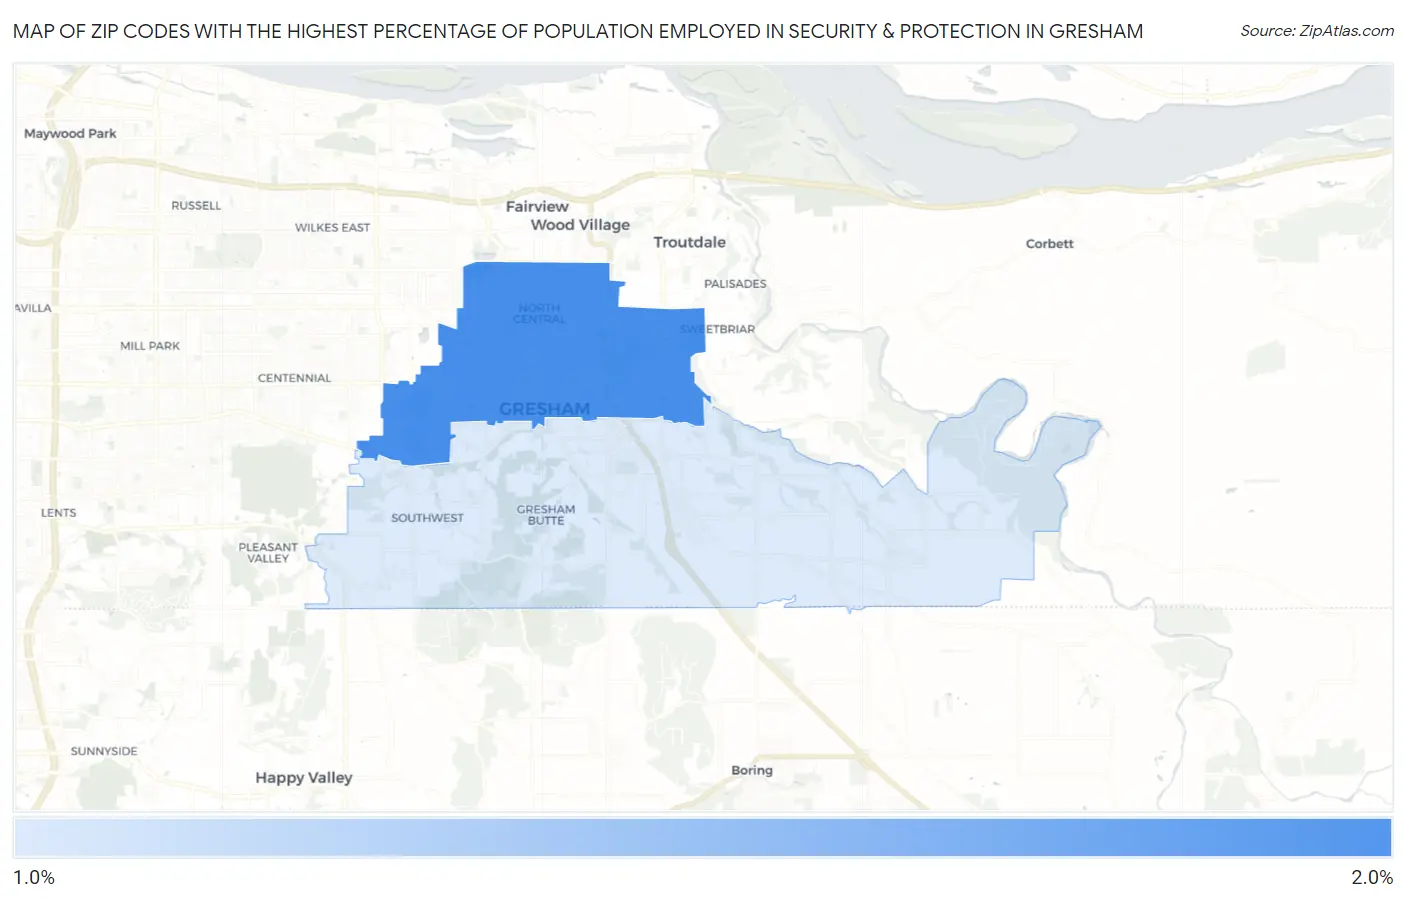
Map of Zip Codes with the Highest Percentage of Population Employed in Security & Protection in Gresham
0.0%
2.0%
Zip Codes with the Highest Percentage of Population Employed in Security & Protection in Gresham, OR
| Zip Code | % Employed | vs State | vs National | |
| 1. | 97030 | 2.0% | 1.7%(+0.344)#136 | 2.1%(-0.150)#12,569 |
| 2. | 97080 | 1.1% | 1.7%(-0.560)#220 | 2.1%(-1.05)#19,333 |
1
Common Questions
What are the Top Zip Codes with the Highest Percentage of Population Employed in Security & Protection in Gresham, OR?
Top Zip Codes with the Highest Percentage of Population Employed in Security & Protection in Gresham, OR are:
What zip code has the Highest Percentage of Population Employed in Security & Protection in Gresham, OR?
97030 has the Highest Percentage of Population Employed in Security & Protection in Gresham, OR with 2.0%.
What is the Percentage of Population Employed in Security & Protection in Gresham, OR?
Percentage of Population Employed in Security & Protection in Gresham is 1.3%.
What is the Percentage of Population Employed in Security & Protection in Oregon?
Percentage of Population Employed in Security & Protection in Oregon is 1.7%.
What is the Percentage of Population Employed in Security & Protection in the United States?
Percentage of Population Employed in Security & Protection in the United States is 2.1%.