Zip Codes with the Highest Percentage of Population Employed in Security & Protection in Beaverton, OR
RELATED REPORTS & OPTIONS
Security & Protection
Beaverton
Compare Zip Codes
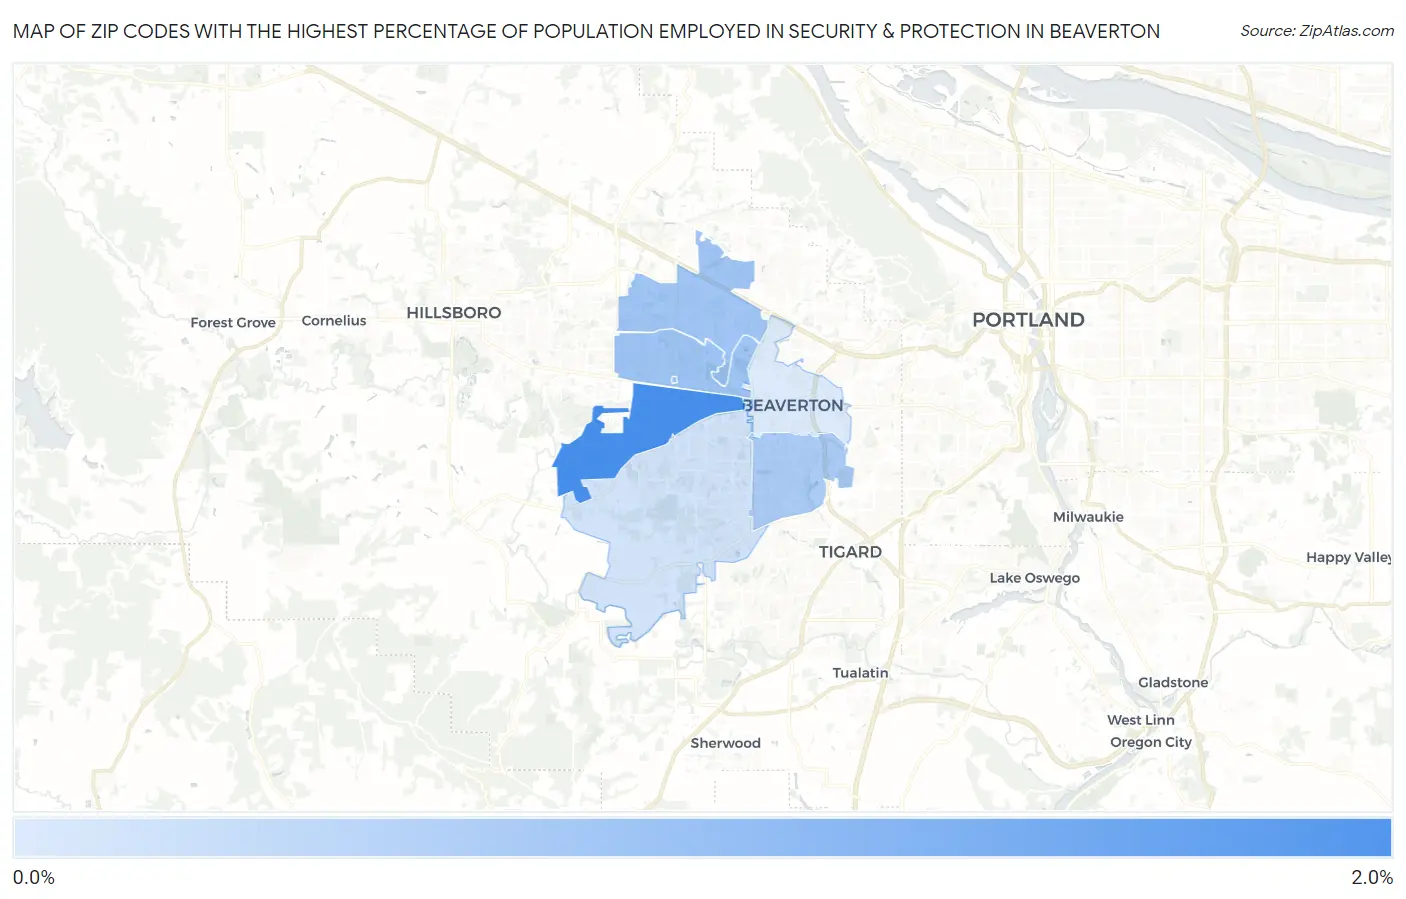
Map of Zip Codes with the Highest Percentage of Population Employed in Security & Protection in Beaverton
0.0%
2.0%
Zip Codes with the Highest Percentage of Population Employed in Security & Protection in Beaverton, OR
| Zip Code | % Employed | vs State | vs National | |
| 1. | 97078 | 2.0% | 1.7%(+0.343)#137 | 2.1%(-0.151)#12,571 |
| 2. | 97003 | 1.1% | 1.7%(-0.508)#217 | 2.1%(-1.00)#18,925 |
| 3. | 97006 | 1.1% | 1.7%(-0.517)#219 | 2.1%(-1.01)#19,014 |
| 4. | 97008 | 1.1% | 1.7%(-0.601)#223 | 2.1%(-1.10)#19,645 |
| 5. | 97007 | 0.67% | 1.7%(-0.983)#261 | 2.1%(-1.48)#22,271 |
| 6. | 97005 | 0.56% | 1.7%(-1.09)#273 | 2.1%(-1.59)#22,884 |
1
Common Questions
What are the Top 5 Zip Codes with the Highest Percentage of Population Employed in Security & Protection in Beaverton, OR?
Top 5 Zip Codes with the Highest Percentage of Population Employed in Security & Protection in Beaverton, OR are:
What zip code has the Highest Percentage of Population Employed in Security & Protection in Beaverton, OR?
97078 has the Highest Percentage of Population Employed in Security & Protection in Beaverton, OR with 2.0%.
What is the Percentage of Population Employed in Security & Protection in Beaverton, OR?
Percentage of Population Employed in Security & Protection in Beaverton is 1.0%.
What is the Percentage of Population Employed in Security & Protection in Oregon?
Percentage of Population Employed in Security & Protection in Oregon is 1.7%.
What is the Percentage of Population Employed in Security & Protection in the United States?
Percentage of Population Employed in Security & Protection in the United States is 2.1%.