Zip Codes with the Highest Percentage of Population Employed in Installation, Maintenance & Repair in Stillwater, OK
RELATED REPORTS & OPTIONS
Installation, Maintenance & Repair
Stillwater
Compare Zip Codes
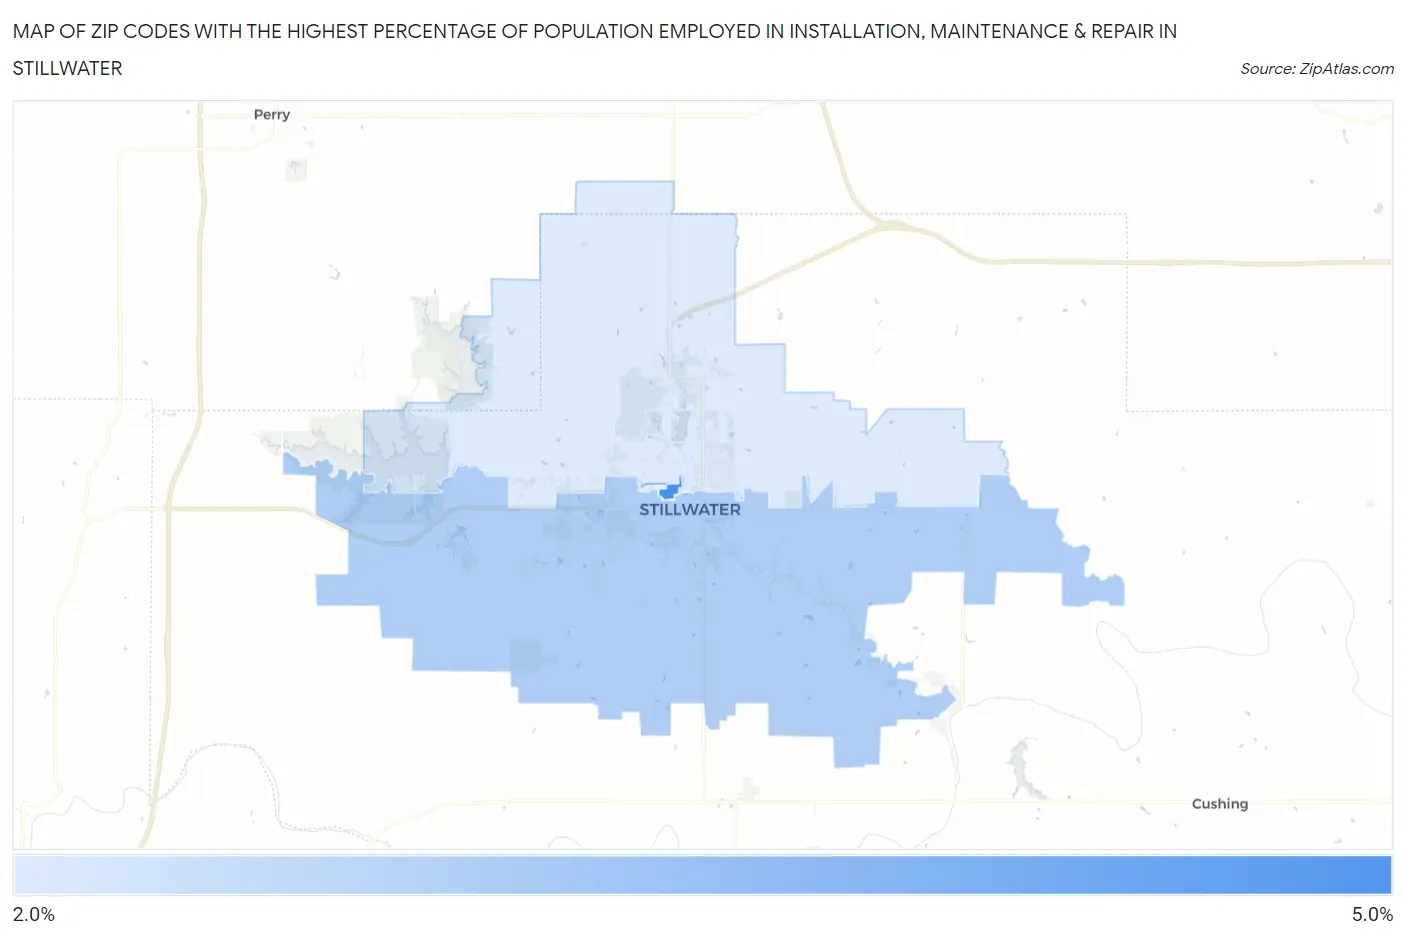
Map of Zip Codes with the Highest Percentage of Population Employed in Installation, Maintenance & Repair in Stillwater
0.0%
5.0%
Zip Codes with the Highest Percentage of Population Employed in Installation, Maintenance & Repair in Stillwater, OK
| Zip Code | % Employed | vs State | vs National | |
| 1. | 74077 | 4.2% | 4.2%(+0.080)#319 | 3.1%(+1.18)#11,339 |
| 2. | 74074 | 2.8% | 4.2%(-1.37)#470 | 3.1%(-0.265)#17,997 |
| 3. | 74075 | 2.2% | 4.2%(-2.00)#523 | 3.1%(-0.901)#21,236 |
1
Common Questions
What are the Top 3 Zip Codes with the Highest Percentage of Population Employed in Installation, Maintenance & Repair in Stillwater, OK?
Top 3 Zip Codes with the Highest Percentage of Population Employed in Installation, Maintenance & Repair in Stillwater, OK are:
What zip code has the Highest Percentage of Population Employed in Installation, Maintenance & Repair in Stillwater, OK?
74077 has the Highest Percentage of Population Employed in Installation, Maintenance & Repair in Stillwater, OK with 4.2%.
What is the Percentage of Population Employed in Installation, Maintenance & Repair in Stillwater, OK?
Percentage of Population Employed in Installation, Maintenance & Repair in Stillwater is 2.1%.
What is the Percentage of Population Employed in Installation, Maintenance & Repair in Oklahoma?
Percentage of Population Employed in Installation, Maintenance & Repair in Oklahoma is 4.2%.
What is the Percentage of Population Employed in Installation, Maintenance & Repair in the United States?
Percentage of Population Employed in Installation, Maintenance & Repair in the United States is 3.1%.