Zip Codes with the Highest Percentage of Population Employed in Community & Social Service in New York, NY

RELATED REPORTS & OPTIONS

Community & Social Service
Population
Families and Households
Female Fertility
Female Fertility (Unmarried)
Race (Community Size)
Race (Percentage)
Ancestry (Community Size)
AfghanAfricanAlbanianAlsatianAmericanApacheArabArgentineanArmenianAssyrian / Chaldean / SyriacAustralianAustrianBahamianBarbadianBasqueBelgianBelizeanBermudanBhutaneseBlackfeetBolivianBrazilianBritishBritish West IndianBulgarianBurmeseCajunCambodianCanadianCape VerdeanCarpatho RusynCelticCentral AmericanCentral American IndianCherokeeChickasawChileanChippewaChoctawColombianCosta RicanCreekCroatianCubanCypriotCzechCzechoslovakianDanishDelawareDominicanDutchDutch West IndianEastern EuropeanEcuadorianEgyptianEnglishEstonianEthiopianEuropeanFilipinoFinnishFrenchFrench American IndianFrench CanadianGermanGhanaianGreekGuamanian / ChamorroGuatemalanGuyaneseHaitianHmongHonduranHungarianIcelanderIndian (Asian)IndonesianIranianIraqiIrishIroquoisIsraeliItalianJamaicanJapaneseJordanianKenyanKoreanLaotianLatvianLebaneseLiberianLithuanianLuxembourgerMacedonianMalaysianMalteseMexicanMexican American IndianMongolianMoroccanNative HawaiianNew ZealanderNicaraguanNigerianNorthern EuropeanNorwegianOkinawanPakistaniPalestinianPanamanianParaguayanPennsylvania GermanPeruvianPolishPortuguesePuebloPuerto RicanRomanianRussianSalvadoranSamoanScandinavianScotch-IrishScottishSenegaleseSerbianSierra LeoneanSiouxSlavicSlovakSloveneSomaliSouth AfricanSouth AmericanSouth American IndianSoviet UnionSpaniardSpanishSpanish AmericanSpanish American IndianSri LankanSubsaharan AfricanSudaneseSwedishSwissSyrianThaiTrinidadian and TobagonianTurkishU.S. Virgin IslanderUgandanUkrainianUruguayanVenezuelanVietnameseWelshWest IndianYugoslavianZimbabwean
Ancestry (Percentage)
AfghanAfricanAlbanianAlsatianAmericanApacheArabArgentineanArmenianAssyrian / Chaldean / SyriacAustralianAustrianBahamianBarbadianBasqueBelgianBelizeanBermudanBhutaneseBlackfeetBolivianBrazilianBritishBritish West IndianBulgarianBurmeseCajunCambodianCanadianCape VerdeanCarpatho RusynCelticCentral AmericanCentral American IndianCherokeeChickasawChileanChippewaChoctawColombianCosta RicanCreekCroatianCubanCypriotCzechCzechoslovakianDanishDelawareDominicanDutchDutch West IndianEastern EuropeanEcuadorianEgyptianEnglishEstonianEthiopianEuropeanFilipinoFinnishFrenchFrench American IndianFrench CanadianGermanGhanaianGreekGuamanian / ChamorroGuatemalanGuyaneseHaitianHmongHonduranHungarianIcelanderIndian (Asian)IndonesianIranianIraqiIrishIroquoisIsraeliItalianJamaicanJapaneseJordanianKenyanKoreanLaotianLatvianLebaneseLiberianLithuanianLuxembourgerMacedonianMalaysianMalteseMexicanMexican American IndianMongolianMoroccanNative HawaiianNew ZealanderNicaraguanNigerianNorthern EuropeanNorwegianOkinawanPakistaniPalestinianPanamanianParaguayanPennsylvania GermanPeruvianPolishPortuguesePuebloPuerto RicanRomanianRussianSalvadoranSamoanScandinavianScotch-IrishScottishSenegaleseSerbianSierra LeoneanSiouxSlavicSlovakSloveneSomaliSouth AfricanSouth AmericanSouth American IndianSoviet UnionSpaniardSpanishSpanish AmericanSpanish American IndianSri LankanSubsaharan AfricanSudaneseSwedishSwissSyrianThaiTrinidadian and TobagonianTurkishU.S. Virgin IslanderUgandanUkrainianUruguayanVenezuelanVietnameseWelshWest IndianYugoslavianZimbabwean
Immigrant Origin (Total)
AfghanistanAfricaAlbaniaArgentinaArmeniaAsiaAustraliaAustriaBahamasBangladeshBarbadosBelarusBelgiumBelizeBoliviaBosnia and HerzegovinaBrazilBulgariaBurma / MyanmarCambodiaCameroonCanadaCaribbeanCentral AmericaChileChinaColombiaCongoCosta RicaCroatiaCubaCzechoslovakiaDenmarkDominicaDominican RepublicEastern AfricaEastern AsiaEastern EuropeEcuadorEgyptEl SalvadorEnglandEritreaEthiopiaEuropeFranceGermanyGhanaGreeceGrenadaGuatemalaGuyanaHaitiHondurasHong KongHungaryIndiaIndonesiaIranIraqIrelandIsraelItalyJamaicaJapanJordanKazakhstanKenyaKoreaKuwaitLatin AmericaLatviaLebanonLiberiaLithuaniaMalaysiaMexicoMiddle AfricaMoldovaMoroccoNepalNetherlandsNicaraguaNigeriaNorth MacedoniaNorthern AfricaNorthern EuropeNorwayOceaniaPakistanPanamaPeruPhilippinesPolandPortugalRomaniaRussiaSaudi ArabiaScotlandSenegalSerbiaSierra LeoneSingaporeSomaliaSouth AfricaSouth AmericaSouth Central AsiaSouth Eastern AsiaSouthern EuropeSpainSri LankaSt. Vincent and the GrenadinesSudanSwedenSwitzerlandSyriaTaiwanThailandTrinidad and TobagoTurkeyUgandaUkraineUruguayUzbekistanVenezuelaVietnamWest IndiesWestern AfricaWestern AsiaWestern EuropeYemenZaireZimbabwe
Immigrant Origin (Percentage)
AfghanistanAfricaAlbaniaArgentinaArmeniaAsiaAustraliaAustriaBahamasBangladeshBarbadosBelarusBelgiumBelizeBoliviaBosnia and HerzegovinaBrazilBulgariaBurma / MyanmarCambodiaCameroonCanadaCaribbeanCentral AmericaChileChinaColombiaCongoCosta RicaCroatiaCubaCzechoslovakiaDenmarkDominicaDominican RepublicEastern AfricaEastern AsiaEastern EuropeEcuadorEgyptEl SalvadorEnglandEritreaEthiopiaEuropeFranceGermanyGhanaGreeceGrenadaGuatemalaGuyanaHaitiHondurasHong KongHungaryIndiaIndonesiaIranIraqIrelandIsraelItalyJamaicaJapanJordanKazakhstanKenyaKoreaKuwaitLatin AmericaLatviaLebanonLiberiaLithuaniaMalaysiaMexicoMiddle AfricaMoldovaMoroccoNepalNetherlandsNicaraguaNigeriaNorth MacedoniaNorthern AfricaNorthern EuropeNorwayOceaniaPakistanPanamaPeruPhilippinesPolandPortugalRomaniaRussiaSaudi ArabiaScotlandSenegalSerbiaSierra LeoneSingaporeSomaliaSouth AfricaSouth AmericaSouth Central AsiaSouth Eastern AsiaSouthern EuropeSpainSri LankaSt. Vincent and the GrenadinesSudanSwedenSwitzerlandSyriaTaiwanThailandTrinidad and TobagoTurkeyUgandaUkraineUruguayUzbekistanVenezuelaVietnamWest IndiesWestern AfricaWestern AsiaWestern EuropeYemenZaireZimbabwe
Income
Income (Families)
Income (Households)
Poverty
Poverty (Families)
Unemployment
Employment Occupations
Employment Industries
Employer Class
Commute Time
Commute Means
School Enrollment
Education by Degree Field
Occupancy
Finances
Physical Characteristics
New York
Compare Zip Codes
Comparison Subject

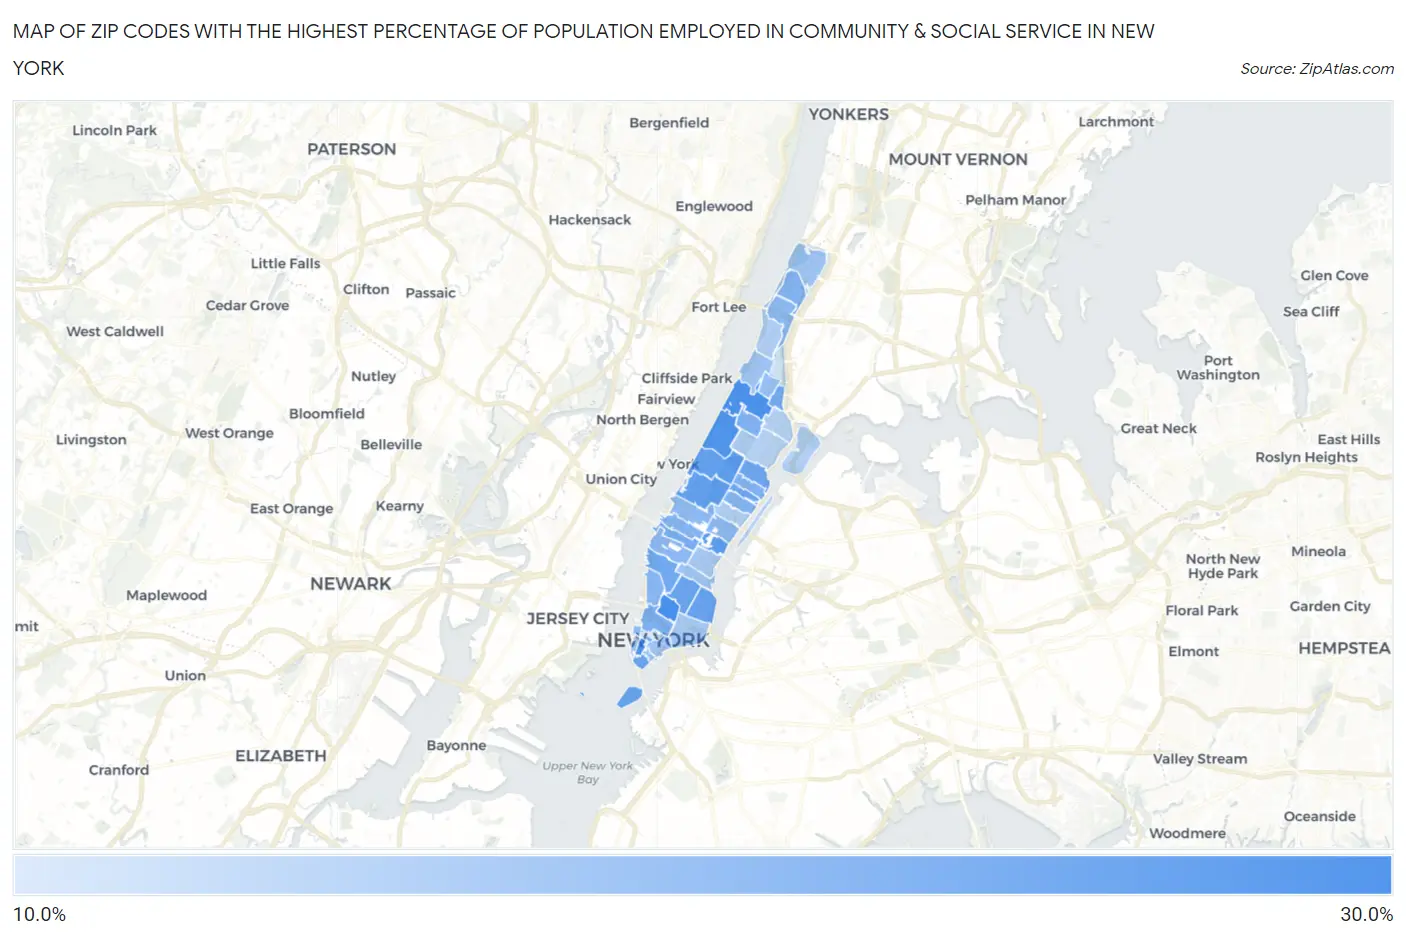
Map of Zip Codes with the Highest Percentage of Population Employed in Community & Social Service in New York

0.0%
30.0%
Zip Codes with the Highest Percentage of Population Employed in Community & Social Service  in New York Map

Zip Codes with the Highest Percentage of Population Employed in Community & Social Service in New York, NY

Zip Code % Employed vs State vs National
1.1001228.7%15.0%(+13.8)#7111.2%(+17.5)#650
2.1002728.3%15.0%(+13.3)#7411.2%(+17.1)#675
3.1000627.6%15.0%(+12.6)#8311.2%(+16.4)#725
4.1002527.4%15.0%(+12.4)#8511.2%(+16.2)#733
5.1001726.1%15.0%(+11.1)#10211.2%(+14.9)#857
6.1002425.3%15.0%(+10.3)#11411.2%(+14.0)#940
7.1002325.2%15.0%(+10.2)#11611.2%(+14.0)#947
8.1000924.6%15.0%(+9.67)#12511.2%(+13.4)#1,027
9.1000424.3%15.0%(+9.37)#13111.2%(+13.1)#1,061
10.1000324.2%15.0%(+9.27)#13411.2%(+13.0)#1,072
11.1007523.9%15.0%(+8.90)#14411.2%(+12.7)#1,126
12.1012823.8%15.0%(+8.85)#14611.2%(+12.6)#1,137
13.1003723.3%15.0%(+8.32)#15911.2%(+12.1)#1,231
14.1001123.1%15.0%(+8.13)#16511.2%(+11.9)#1,261
15.1001822.3%15.0%(+7.28)#19011.2%(+11.0)#1,407
16.1001321.7%15.0%(+6.75)#21511.2%(+10.5)#1,539
17.1002821.4%15.0%(+6.40)#22811.2%(+10.2)#1,620
18.1002621.4%15.0%(+6.39)#22911.2%(+10.2)#1,623
19.1002121.2%15.0%(+6.26)#23211.2%(+10.0)#1,652
20.1004021.2%15.0%(+6.21)#23511.2%(+9.97)#1,667
21.1003620.8%15.0%(+5.83)#24711.2%(+9.59)#1,776
22.1001420.7%15.0%(+5.72)#25211.2%(+9.48)#1,811
23.1016220.4%15.0%(+5.41)#26711.2%(+9.17)#1,913
24.1002220.3%15.0%(+5.37)#27011.2%(+9.13)#1,921
25.1000120.2%15.0%(+5.18)#27911.2%(+8.94)#1,968
26.1003319.7%15.0%(+4.75)#29711.2%(+8.51)#2,118
27.1001919.7%15.0%(+4.72)#29911.2%(+8.48)#2,126
28.1028219.6%15.0%(+4.60)#30811.2%(+8.36)#2,172
29.1003019.0%15.0%(+3.99)#33011.2%(+7.75)#2,407
30.1000518.2%15.0%(+3.23)#37211.2%(+6.99)#2,714
31.1001017.9%15.0%(+2.98)#38811.2%(+6.74)#2,840
32.1003117.9%15.0%(+2.93)#39211.2%(+6.68)#2,875
33.1003417.8%15.0%(+2.88)#39311.2%(+6.64)#2,899
34.1003817.5%15.0%(+2.48)#41211.2%(+6.24)#3,084
35.1028017.2%15.0%(+2.20)#43811.2%(+5.96)#3,267
36.1001616.9%15.0%(+1.94)#46011.2%(+5.70)#3,435
37.1000216.8%15.0%(+1.82)#47511.2%(+5.58)#3,514
38.1006516.1%15.0%(+1.08)#53511.2%(+4.84)#4,037
39.1003215.8%15.0%(+0.863)#54811.2%(+4.62)#4,200
40.1003515.5%15.0%(+0.504)#57911.2%(+4.26)#4,520
41.1006915.3%15.0%(+0.371)#59211.2%(+4.13)#4,662
42.1002915.0%15.0%(+0.055)#61811.2%(+3.82)#4,939
43.1004414.9%15.0%(-0.122)#63211.2%(+3.64)#5,111
44.1003912.0%15.0%(-3.01)#94211.2%(+0.751)#9,445
45.1000710.7%15.0%(-4.31)#1,10511.2%(-0.546)#12,461

Common Questions

What are the Top 10 Zip Codes with the Highest Percentage of Population Employed in Community & Social Service in New York, NY?
Top 10 Zip Codes with the Highest Percentage of Population Employed in Community & Social Service in New York, NY are:
#1
28.7%
#2
28.3%
#3
27.6%
#4
27.4%
#5
26.1%
#6
25.3%
#7
25.2%
#8
24.6%
#9
24.3%
#10
24.2%
What zip code has the Highest Percentage of Population Employed in Community & Social Service in New York, NY?
10012 has the Highest Percentage of Population Employed in Community & Social Service in New York, NY with 28.7%.
What is the Percentage of Population Employed in Community & Social Service in New York, NY?
Percentage of Population Employed in Community & Social Service in New York is 15.8%.
What is the Percentage of Population Employed in Community & Social Service in New York?
Percentage of Population Employed in Community & Social Service in New York is 15.0%.
What is the Percentage of Population Employed in Community & Social Service in the United States?
Percentage of Population Employed in Community & Social Service in the United States is 11.2%.