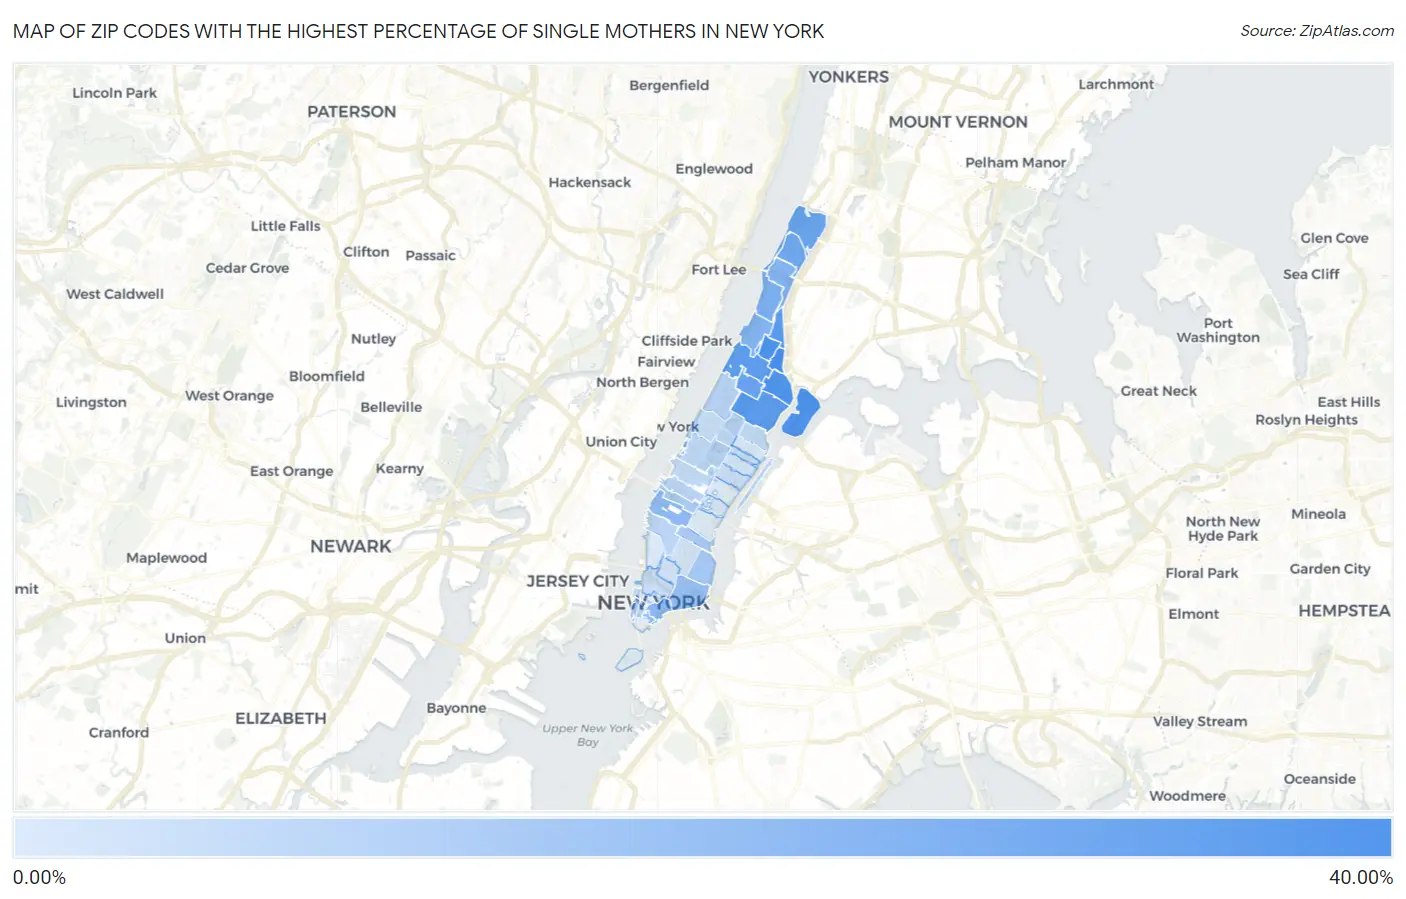
Zip Codes with the Highest Percentage of Single Mothers in New York, NY
RELATED REPORTS & OPTIONS
Most Single Mothers
New York
Compare Zip Codes
Map of Zip Codes with the Highest Percentage of Single Mothers in New York
0.00%
40.00%
Zip Codes with the Highest Percentage of Single Mothers in New York, NY
| Zip Code | % Single Mothers | vs State | vs National | |
| 1. | 10037 | 30.76% | 12.09%(+18.7)#66 | 11.49%(+19.3)#1,022 |
| 2. | 10030 | 29.57% | 12.09%(+17.5)#70 | 11.49%(+18.1)#1,140 |
| 3. | 10035 | 29.26% | 12.09%(+17.2)#73 | 11.49%(+17.8)#1,169 |
| 4. | 10029 | 26.98% | 12.09%(+14.9)#85 | 11.49%(+15.5)#1,472 |
| 5. | 10039 | 26.40% | 12.09%(+14.3)#90 | 11.49%(+14.9)#1,552 |
| 6. | 10027 | 25.96% | 12.09%(+13.9)#94 | 11.49%(+14.5)#1,617 |
| 7. | 10026 | 23.81% | 12.09%(+11.7)#115 | 11.49%(+12.3)#2,048 |
| 8. | 10034 | 23.32% | 12.09%(+11.2)#123 | 11.49%(+11.8)#2,163 |
| 9. | 10040 | 22.18% | 12.09%(+10.1)#131 | 11.49%(+10.7)#2,463 |
| 10. | 10069 | 20.90% | 12.09%(+8.81)#145 | 11.49%(+9.42)#2,901 |
| 11. | 10032 | 19.71% | 12.09%(+7.62)#173 | 11.49%(+8.22)#3,371 |
| 12. | 10031 | 18.34% | 12.09%(+6.25)#203 | 11.49%(+6.85)#3,980 |
| 13. | 10033 | 17.95% | 12.09%(+5.86)#215 | 11.49%(+6.46)#4,173 |
| 14. | 10038 | 17.21% | 12.09%(+5.12)#235 | 11.49%(+5.72)#4,585 |
| 15. | 10001 | 16.31% | 12.09%(+4.22)#257 | 11.49%(+4.83)#5,149 |
| 16. | 10002 | 14.46% | 12.09%(+2.38)#308 | 11.49%(+2.98)#6,512 |
| 17. | 10005 | 14.39% | 12.09%(+2.30)#312 | 11.49%(+2.90)#6,580 |
| 18. | 10009 | 11.60% | 12.09%(-0.493)#466 | 11.49%(+0.108)#9,766 |
| 19. | 10018 | 11.16% | 12.09%(-0.925)#507 | 11.49%(-0.324)#10,361 |
| 20. | 10010 | 10.95% | 12.09%(-1.14)#523 | 11.49%(-0.534)#10,675 |
| 21. | 10280 | 10.85% | 12.09%(-1.24)#532 | 11.49%(-0.634)#10,799 |
| 22. | 10025 | 8.93% | 12.09%(-3.15)#707 | 11.49%(-2.55)#13,927 |
| 23. | 10006 | 8.79% | 12.09%(-3.30)#719 | 11.49%(-2.70)#14,185 |
| 24. | 10036 | 8.21% | 12.09%(-3.88)#779 | 11.49%(-3.28)#15,300 |
| 25. | 10044 | 7.59% | 12.09%(-4.50)#837 | 11.49%(-3.90)#16,452 |
| 26. | 10011 | 7.50% | 12.09%(-4.59)#850 | 11.49%(-3.99)#16,650 |
| 27. | 10023 | 7.34% | 12.09%(-4.75)#875 | 11.49%(-4.15)#17,006 |
| 28. | 10128 | 6.96% | 12.09%(-5.13)#913 | 11.49%(-4.52)#17,788 |
| 29. | 10282 | 6.82% | 12.09%(-5.27)#937 | 11.49%(-4.67)#18,084 |
| 30. | 10019 | 6.57% | 12.09%(-5.52)#965 | 11.49%(-4.92)#18,595 |
| 31. | 10075 | 5.99% | 12.09%(-6.10)#1,036 | 11.49%(-5.50)#19,738 |
| 32. | 10024 | 5.74% | 12.09%(-6.35)#1,070 | 11.49%(-5.75)#20,249 |
| 33. | 10065 | 5.37% | 12.09%(-6.72)#1,107 | 11.49%(-6.12)#20,992 |
| 34. | 10013 | 5.14% | 12.09%(-6.95)#1,132 | 11.49%(-6.35)#21,433 |
| 35. | 10012 | 4.44% | 12.09%(-7.65)#1,217 | 11.49%(-7.05)#22,802 |
| 36. | 10021 | 4.04% | 12.09%(-8.05)#1,250 | 11.49%(-7.44)#23,485 |
| 37. | 10003 | 3.94% | 12.09%(-8.14)#1,259 | 11.49%(-7.54)#23,650 |
| 38. | 10162 | 3.79% | 12.09%(-8.30)#1,276 | 11.49%(-7.70)#23,925 |
| 39. | 10017 | 3.59% | 12.09%(-8.50)#1,294 | 11.49%(-7.90)#24,252 |
| 40. | 10028 | 2.90% | 12.09%(-9.18)#1,354 | 11.49%(-8.58)#25,357 |
| 41. | 10014 | 2.40% | 12.09%(-9.68)#1,391 | 11.49%(-9.08)#26,016 |
| 42. | 10016 | 2.04% | 12.09%(-10.1)#1,413 | 11.49%(-9.45)#26,468 |
| 43. | 10022 | 1.92% | 12.09%(-10.2)#1,422 | 11.49%(-9.57)#26,613 |
1
Common Questions
What are the Top 10 Zip Codes with the Highest Percentage of Single Mothers in New York, NY?
Top 10 Zip Codes with the Highest Percentage of Single Mothers in New York, NY are:
What zip code has the Highest Percentage of Single Mothers in New York, NY?
10037 has the Highest Percentage of Single Mothers in New York, NY with 30.76%.
What is the Percentage of Single Mothers in New York, NY?
Percentage of Single Mothers in New York is 15.20%.
What is the Percentage of Single Mothers in New York?
Percentage of Single Mothers in New York is 12.09%.
What is the Percentage of Single Mothers in the United States?
Percentage of Single Mothers in the United States is 11.49%.