Zip Codes with the Highest Percentage of Self-Employed / Incorporated in Buffalo, NY

RELATED REPORTS & OPTIONS

Self-Employed / Incorporated
Population
Families and Households
Female Fertility
Female Fertility (Unmarried)
Race (Community Size)
Race (Percentage)
Ancestry (Community Size)
AfghanAfricanAlbanianAlsatianAmericanArabArgentineanArmenianAustralianAustrianBahamianBarbadianBelgianBelizeanBhutaneseBlackfeetBolivianBrazilianBritishBritish West IndianBulgarianBurmeseCajunCambodianCanadianCarpatho RusynCelticCentral AmericanCentral American IndianCherokeeChileanChippewaColombianCosta RicanCreekCroatianCubanCzechCzechoslovakianDanishDominicanDutchDutch West IndianEastern EuropeanEcuadorianEgyptianEnglishEstonianEthiopianEuropeanFilipinoFinnishFrenchFrench American IndianFrench CanadianGermanGerman RussianGhanaianGreekGuamanian / ChamorroGuatemalanGuyaneseHaitianHonduranHungarianIcelanderIndian (Asian)IndonesianIranianIraqiIrishIroquoisIsraeliItalianJamaicanJapaneseJordanianKenyanKoreanLaotianLatvianLebaneseLithuanianMacedonianMalaysianMalteseMexicanMexican American IndianMongolianMoroccanNative HawaiianNavajoNicaraguanNigerianNorthern EuropeanNorwegianOkinawanPakistaniPalestinianPanamanianPennsylvania GermanPeruvianPolishPortuguesePuerto RicanRomanianRussianSalvadoranSamoanScandinavianScotch-IrishScottishSerbianSiouxSlavicSlovakSloveneSomaliSouth AfricanSouth AmericanSouth American IndianSpaniardSpanishSri LankanSubsaharan AfricanSudaneseSwedishSwissSyrianTaiwaneseThaiTrinidadian and TobagonianTurkishUkrainianVenezuelanVietnameseWelshWest IndianYugoslavian
Ancestry (Percentage)
AfghanAfricanAlbanianAlsatianAmericanArabArgentineanArmenianAustralianAustrianBahamianBarbadianBelgianBelizeanBhutaneseBlackfeetBolivianBrazilianBritishBritish West IndianBulgarianBurmeseCajunCambodianCanadianCarpatho RusynCelticCentral AmericanCentral American IndianCherokeeChileanChippewaColombianCosta RicanCreekCroatianCubanCzechCzechoslovakianDanishDominicanDutchDutch West IndianEastern EuropeanEcuadorianEgyptianEnglishEstonianEthiopianEuropeanFilipinoFinnishFrenchFrench American IndianFrench CanadianGermanGerman RussianGhanaianGreekGuamanian / ChamorroGuatemalanGuyaneseHaitianHonduranHungarianIcelanderIndian (Asian)IndonesianIranianIraqiIrishIroquoisIsraeliItalianJamaicanJapaneseJordanianKenyanKoreanLaotianLatvianLebaneseLithuanianMacedonianMalaysianMalteseMexicanMexican American IndianMongolianMoroccanNative HawaiianNavajoNicaraguanNigerianNorthern EuropeanNorwegianOkinawanPakistaniPalestinianPanamanianPennsylvania GermanPeruvianPolishPortuguesePuerto RicanRomanianRussianSalvadoranSamoanScandinavianScotch-IrishScottishSerbianSiouxSlavicSlovakSloveneSomaliSouth AfricanSouth AmericanSouth American IndianSpaniardSpanishSri LankanSubsaharan AfricanSudaneseSwedishSwissSyrianTaiwaneseThaiTrinidadian and TobagonianTurkishUkrainianVenezuelanVietnameseWelshWest IndianYugoslavian
Immigrant Origin (Total)
AfghanistanAfricaAlbaniaArgentinaAsiaAustraliaAustriaBangladeshBarbadosBelarusBosnia and HerzegovinaBrazilBulgariaBurma / MyanmarCameroonCanadaCaribbeanCentral AmericaChinaColombiaCongoCosta RicaCroatiaCubaCzechoslovakiaDominican RepublicEastern AfricaEastern AsiaEastern EuropeEcuadorEgyptEl SalvadorEnglandEritreaEthiopiaEuropeFranceGermanyGhanaGreeceGuatemalaGuyanaHaitiHondurasHong KongHungaryIndiaIndonesiaIranIraqIrelandIsraelItalyJamaicaJapanJordanKazakhstanKenyaKoreaKuwaitLaosLatin AmericaLatviaLebanonLiberiaLithuaniaMalaysiaMexicoMiddle AfricaMoldovaMoroccoNepalNetherlandsNigeriaNorth MacedoniaNorthern AfricaNorthern EuropeNorwayOceaniaPakistanPanamaPeruPhilippinesPolandRomaniaRussiaSaudi ArabiaScotlandSerbiaSierra LeoneSingaporeSomaliaSouth AfricaSouth AmericaSouth Central AsiaSouth Eastern AsiaSouthern EuropeSpainSri LankaSt. Vincent and the GrenadinesSudanSwedenSwitzerlandSyriaTaiwanThailandTrinidad and TobagoTurkeyUgandaUkraineUzbekistanVenezuelaVietnamWest IndiesWestern AfricaWestern AsiaWestern EuropeYemenZaire
Immigrant Origin (Percentage)
AfghanistanAfricaAlbaniaArgentinaAsiaAustraliaAustriaBangladeshBarbadosBelarusBosnia and HerzegovinaBrazilBulgariaBurma / MyanmarCameroonCanadaCaribbeanCentral AmericaChinaColombiaCongoCosta RicaCroatiaCubaCzechoslovakiaDominican RepublicEastern AfricaEastern AsiaEastern EuropeEcuadorEgyptEl SalvadorEnglandEritreaEthiopiaEuropeFranceGermanyGhanaGreeceGuatemalaGuyanaHaitiHondurasHong KongHungaryIndiaIndonesiaIranIraqIrelandIsraelItalyJamaicaJapanJordanKazakhstanKenyaKoreaKuwaitLaosLatin AmericaLatviaLebanonLiberiaLithuaniaMalaysiaMexicoMiddle AfricaMoldovaMoroccoNepalNetherlandsNigeriaNorth MacedoniaNorthern AfricaNorthern EuropeNorwayOceaniaPakistanPanamaPeruPhilippinesPolandRomaniaRussiaSaudi ArabiaScotlandSerbiaSierra LeoneSingaporeSomaliaSouth AfricaSouth AmericaSouth Central AsiaSouth Eastern AsiaSouthern EuropeSpainSri LankaSt. Vincent and the GrenadinesSudanSwedenSwitzerlandSyriaTaiwanThailandTrinidad and TobagoTurkeyUgandaUkraineUzbekistanVenezuelaVietnamWest IndiesWestern AfricaWestern AsiaWestern EuropeYemenZaire
Income
Income (Families)
Income (Households)
Poverty
Poverty (Families)
Unemployment
Employment Occupations
Employment Industries
Employer Class
Commute Time
Commute Means
School Enrollment
Education by Degree Field
Occupancy
Finances
Physical Characteristics
Buffalo
Compare Zip Codes
Comparison Subject

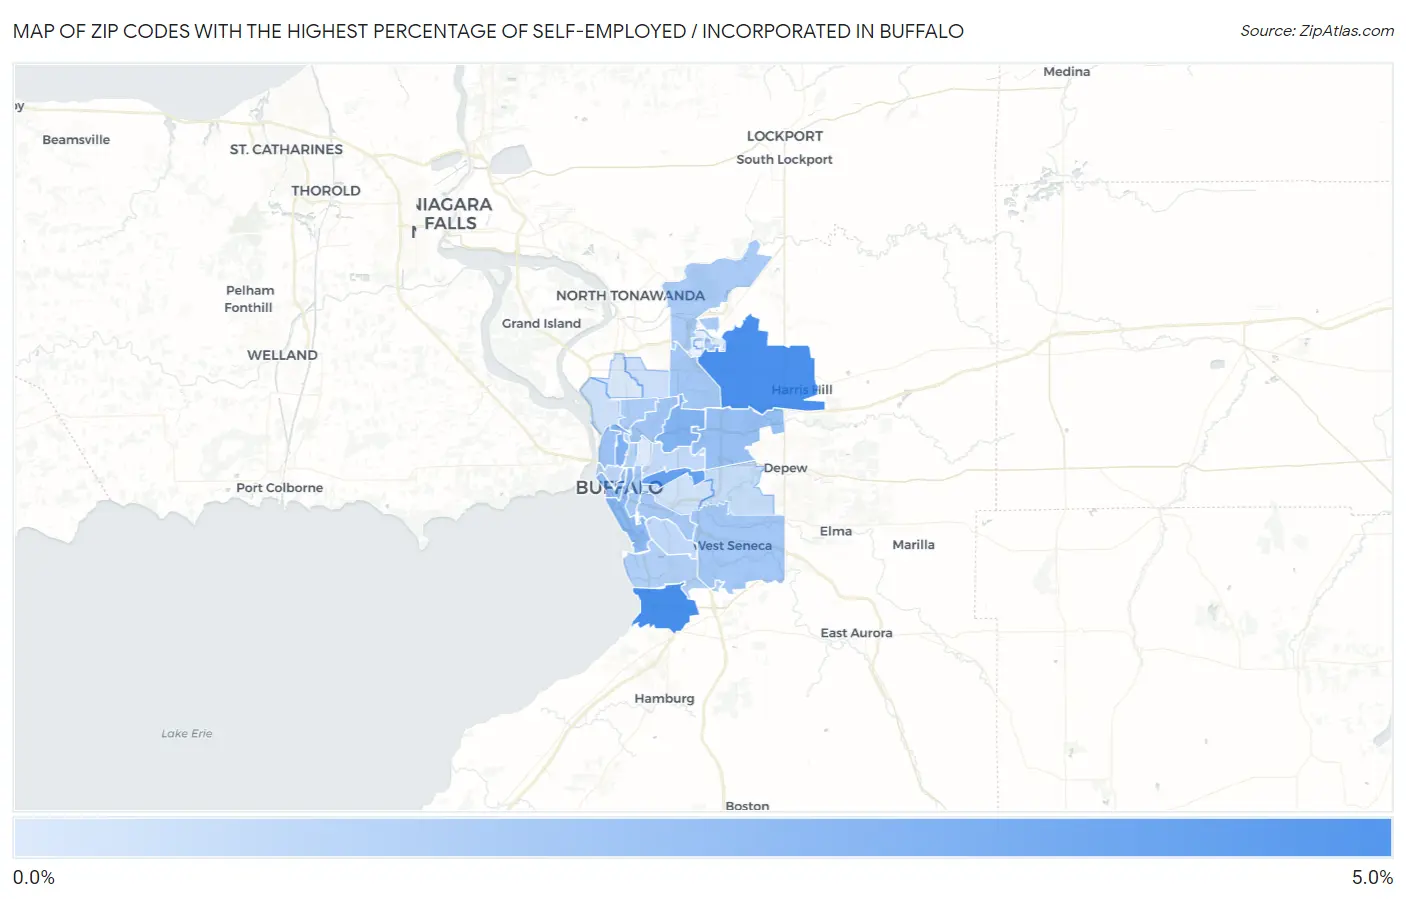
Map of Zip Codes with the Highest Percentage of Self-Employed / Incorporated in Buffalo

0.0%
5.0%
Zip Codes with the Highest Percentage of Self-Employed / Incorporated in Buffalo Map

Zip Codes with the Highest Percentage of Self-Employed / Incorporated in Buffalo, NY

Zip Code % Self-Employed / Incorporated vs State vs National
1.142194.7%3.9%(+0.769)#5623.8%(+0.840)#9,596
2.142214.6%3.9%(+0.705)#5723.8%(+0.776)#9,801
3.142123.9%3.9%(+0.031)#7083.8%(+0.101)#12,266
4.142153.2%3.9%(-0.687)#8693.8%(-0.617)#15,401
5.142223.2%3.9%(-0.702)#8743.8%(-0.632)#15,474
6.142032.8%3.9%(-1.05)#9583.8%(-0.978)#17,192
7.142022.6%3.9%(-1.26)#1,0163.8%(-1.19)#18,302
8.142252.6%3.9%(-1.28)#1,0193.8%(-1.21)#18,377
9.142132.5%3.9%(-1.39)#1,0503.8%(-1.32)#18,902
10.142142.4%3.9%(-1.52)#1,0803.8%(-1.45)#19,559
11.142242.3%3.9%(-1.56)#1,0953.8%(-1.49)#19,727
12.142262.3%3.9%(-1.57)#1,0963.8%(-1.50)#19,776
13.142102.3%3.9%(-1.61)#1,1053.8%(-1.54)#19,958
14.142042.2%3.9%(-1.66)#1,1233.8%(-1.59)#20,236
15.142282.1%3.9%(-1.74)#1,1483.8%(-1.67)#20,657
16.142162.1%3.9%(-1.77)#1,1563.8%(-1.70)#20,820
17.142182.0%3.9%(-1.89)#1,1903.8%(-1.82)#21,394
18.142091.8%3.9%(-2.08)#1,2383.8%(-2.01)#22,246
19.142011.7%3.9%(-2.17)#1,2613.8%(-2.10)#22,589
20.142201.7%3.9%(-2.23)#1,2723.8%(-2.16)#22,865
21.142111.6%3.9%(-2.29)#1,2883.8%(-2.22)#23,103
22.142271.4%3.9%(-2.44)#1,3093.8%(-2.37)#23,677
23.142231.4%3.9%(-2.51)#1,3273.8%(-2.44)#23,962
24.142071.3%3.9%(-2.60)#1,3493.8%(-2.53)#24,296
25.142061.2%3.9%(-2.66)#1,3673.8%(-2.59)#24,513
26.142171.0%3.9%(-2.88)#1,4093.8%(-2.81)#25,276
27.142080.91%3.9%(-2.98)#1,4183.8%(-2.91)#25,531

Common Questions

What are the Top 10 Zip Codes with the Highest Percentage of Self-Employed / Incorporated in Buffalo, NY?
Top 10 Zip Codes with the Highest Percentage of Self-Employed / Incorporated in Buffalo, NY are:
#1
4.7%
#2
4.6%
#3
3.9%
#4
3.2%
#5
3.2%
#6
2.8%
#7
2.6%
#8
2.6%
#9
2.5%
#10
2.4%
What zip code has the Highest Percentage of Self-Employed / Incorporated in Buffalo, NY?
14219 has the Highest Percentage of Self-Employed / Incorporated in Buffalo, NY with 4.7%.
What is the Percentage of Self-Employed / Incorporated in Buffalo, NY?
Percentage of Self-Employed / Incorporated in Buffalo is 2.1%.
What is the Percentage of Self-Employed / Incorporated in New York?
Percentage of Self-Employed / Incorporated in New York is 3.9%.
What is the Percentage of Self-Employed / Incorporated in the United States?
Percentage of Self-Employed / Incorporated in the United States is 3.8%.