Zip Codes with the Highest Percentage of Population Employed in Agriculture, Fishing & Hunting in North Las Vegas, NV
RELATED REPORTS & OPTIONS
Agriculture, Fishing & Hunting
North Las Vegas
Compare Zip Codes
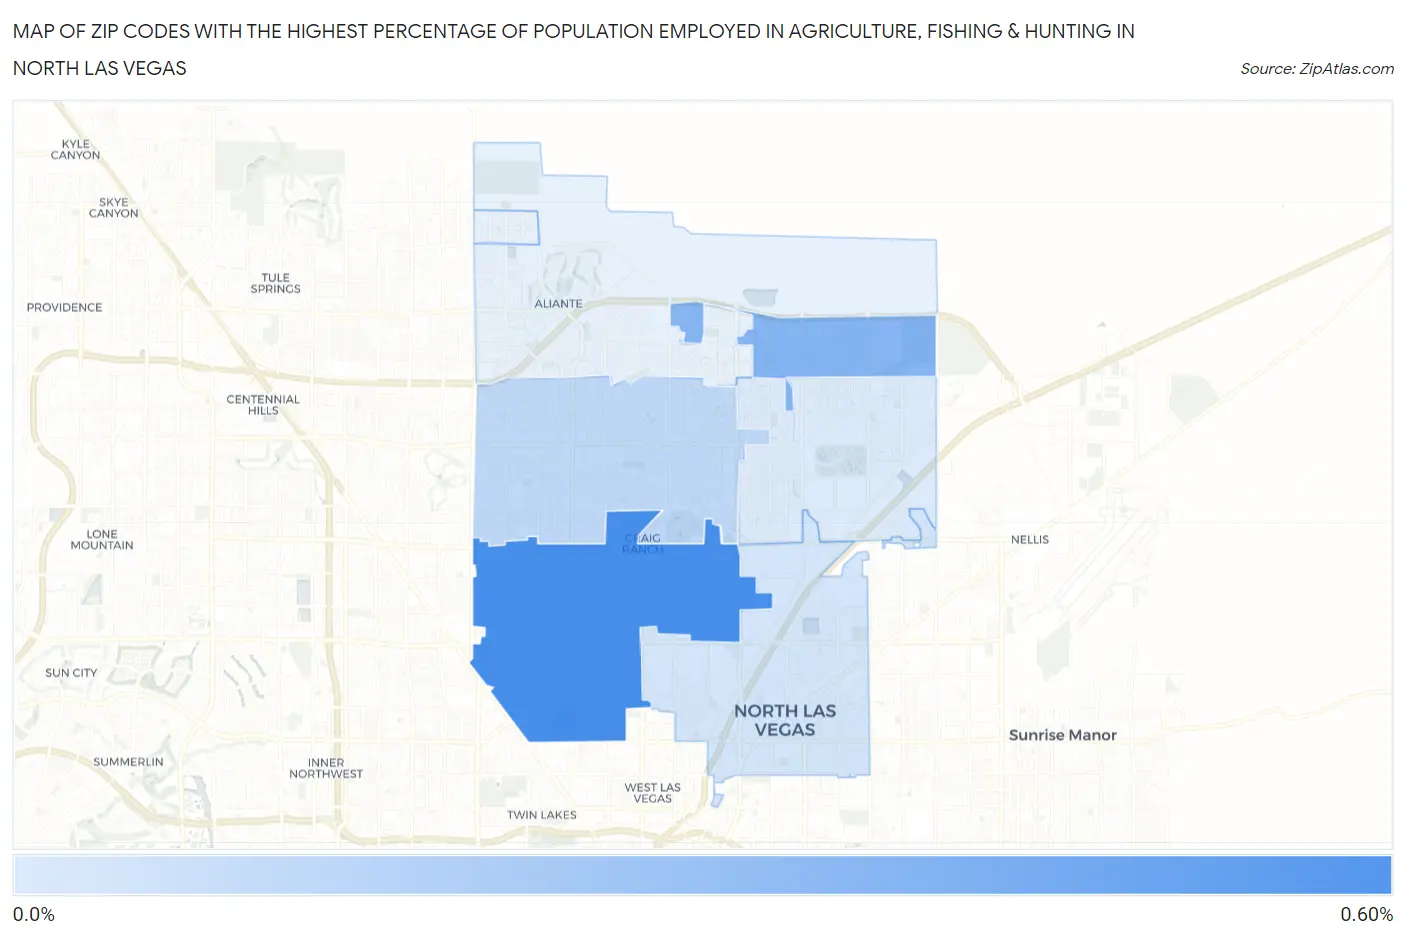
Map of Zip Codes with the Highest Percentage of Population Employed in Agriculture, Fishing & Hunting in North Las Vegas
0.0%
0.60%
Zip Codes with the Highest Percentage of Population Employed in Agriculture, Fishing & Hunting in North Las Vegas, NV
| Zip Code | % Employed | vs State | vs National | |
| 1. | 89032 | 0.54% | 0.40%(+0.144)#52 | 1.2%(-0.660)#18,941 |
| 2. | 89086 | 0.33% | 0.40%(-0.065)#69 | 1.2%(-0.869)#20,844 |
| 3. | 89031 | 0.14% | 0.40%(-0.256)#88 | 1.2%(-1.06)#23,159 |
| 4. | 89030 | 0.075% | 0.40%(-0.320)#96 | 1.2%(-1.12)#24,024 |
| 5. | 89081 | 0.043% | 0.40%(-0.353)#101 | 1.2%(-1.16)#24,417 |
1
Common Questions
What are the Top 5 Zip Codes with the Highest Percentage of Population Employed in Agriculture, Fishing & Hunting in North Las Vegas, NV?
Top 5 Zip Codes with the Highest Percentage of Population Employed in Agriculture, Fishing & Hunting in North Las Vegas, NV are:
What zip code has the Highest Percentage of Population Employed in Agriculture, Fishing & Hunting in North Las Vegas, NV?
89032 has the Highest Percentage of Population Employed in Agriculture, Fishing & Hunting in North Las Vegas, NV with 0.54%.
What is the Percentage of Population Employed in Agriculture, Fishing & Hunting in North Las Vegas, NV?
Percentage of Population Employed in Agriculture, Fishing & Hunting in North Las Vegas is 0.17%.
What is the Percentage of Population Employed in Agriculture, Fishing & Hunting in Nevada?
Percentage of Population Employed in Agriculture, Fishing & Hunting in Nevada is 0.40%.
What is the Percentage of Population Employed in Agriculture, Fishing & Hunting in the United States?
Percentage of Population Employed in Agriculture, Fishing & Hunting in the United States is 1.2%.