Zip Codes with the Highest Percentage of Population Employed in Agriculture, Fishing & Hunting in Trenton, NJ
RELATED REPORTS & OPTIONS
Agriculture, Fishing & Hunting
Trenton
Compare Zip Codes
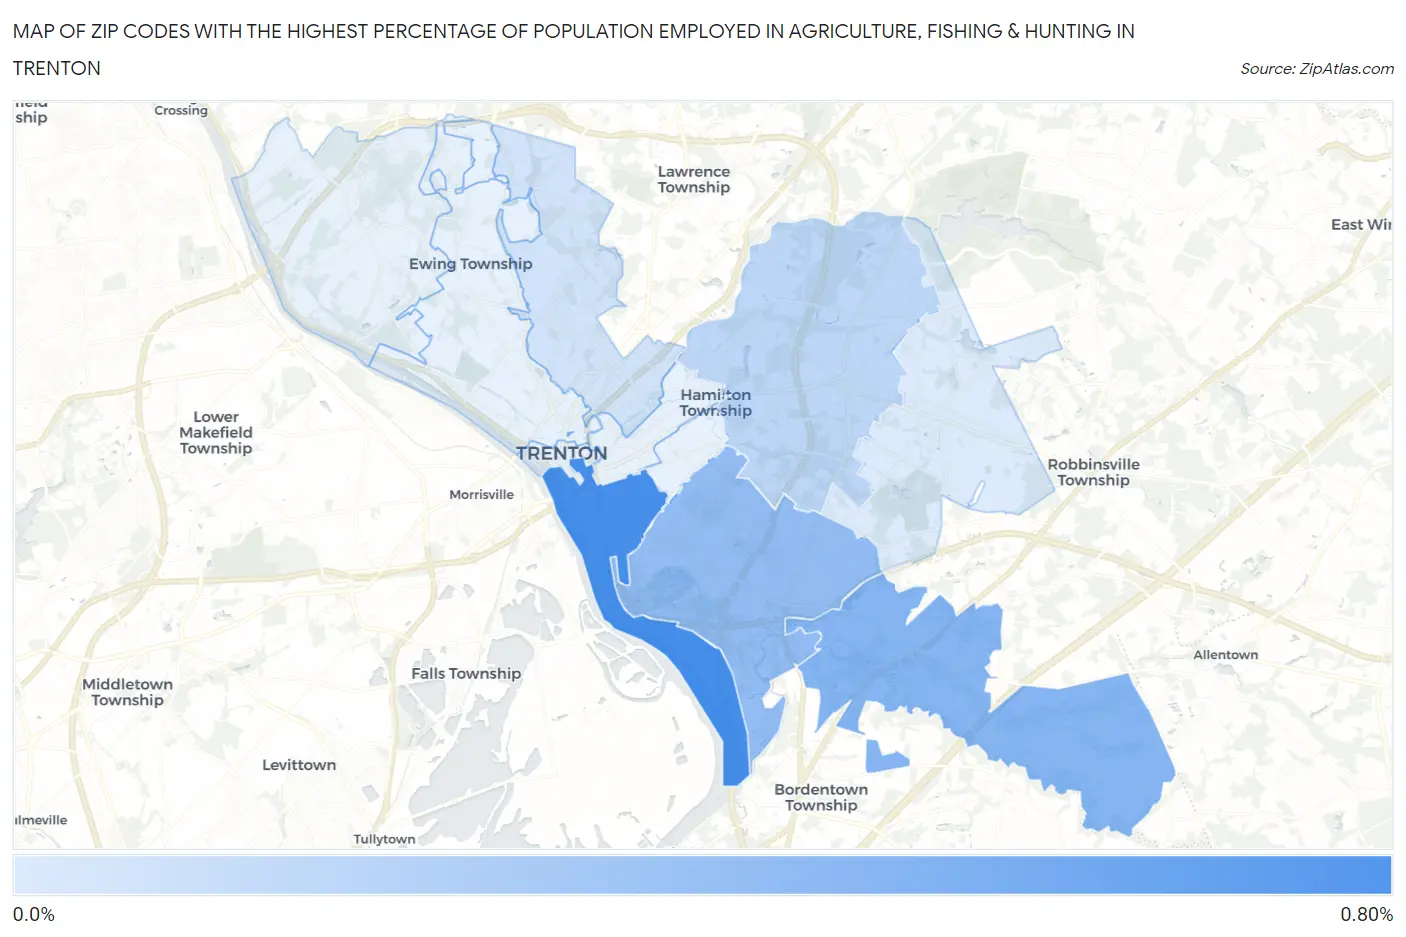
Map of Zip Codes with the Highest Percentage of Population Employed in Agriculture, Fishing & Hunting in Trenton
0.0%
0.80%
Zip Codes with the Highest Percentage of Population Employed in Agriculture, Fishing & Hunting in Trenton, NJ
| Zip Code | % Employed | vs State | vs National | |
| 1. | 08611 | 0.64% | 0.26%(+0.376)#86 | 1.2%(-0.561)#18,209 |
| 2. | 08620 | 0.41% | 0.26%(+0.146)#130 | 1.2%(-0.791)#20,075 |
| 3. | 08610 | 0.37% | 0.26%(+0.104)#143 | 1.2%(-0.832)#20,472 |
| 4. | 08619 | 0.21% | 0.26%(-0.055)#197 | 1.2%(-0.992)#22,266 |
| 5. | 08638 | 0.13% | 0.26%(-0.128)#238 | 1.2%(-1.06)#23,225 |
| 6. | 08690 | 0.090% | 0.26%(-0.173)#271 | 1.2%(-1.11)#23,820 |
1
Common Questions
What are the Top 10 Zip Codes with the Highest Percentage of Population Employed in Agriculture, Fishing & Hunting in Trenton, NJ?
Top 10 Zip Codes with the Highest Percentage of Population Employed in Agriculture, Fishing & Hunting in Trenton, NJ are:
What zip code has the Highest Percentage of Population Employed in Agriculture, Fishing & Hunting in Trenton, NJ?
08611 has the Highest Percentage of Population Employed in Agriculture, Fishing & Hunting in Trenton, NJ with 0.64%.
What is the Percentage of Population Employed in Agriculture, Fishing & Hunting in Trenton, NJ?
Percentage of Population Employed in Agriculture, Fishing & Hunting in Trenton is 0.23%.
What is the Percentage of Population Employed in Agriculture, Fishing & Hunting in New Jersey?
Percentage of Population Employed in Agriculture, Fishing & Hunting in New Jersey is 0.26%.
What is the Percentage of Population Employed in Agriculture, Fishing & Hunting in the United States?
Percentage of Population Employed in Agriculture, Fishing & Hunting in the United States is 1.2%.