Zip Codes with the Highest Percentage of Families with Income Below $10,000 in Trenton, NJ
RELATED REPORTS & OPTIONS
Family Income | $0-10k
Trenton
Compare Zip Codes
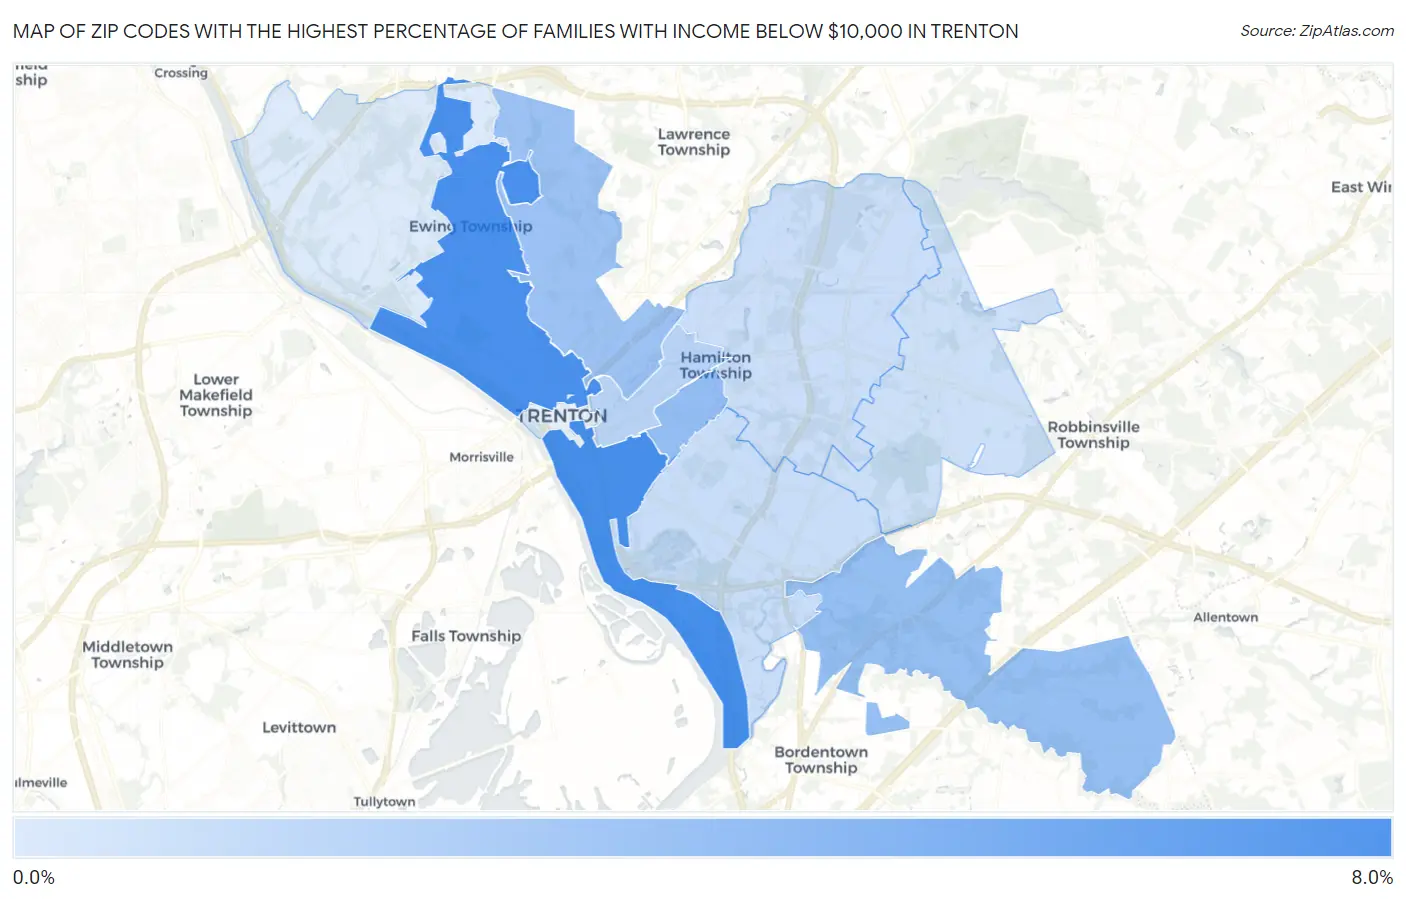
Map of Zip Codes with the Highest Percentage of Families with Income Below $10,000 in Trenton
0.0%
8.0%
Zip Codes with the Highest Percentage of Families with Income Below $10,000 in Trenton, NJ
| Zip Code | Families with Income < $10k | vs State | vs National | |
| 1. | 08611 | 7.6% | 2.4%(+5.20)#24 | 3.1%(+4.50)#3,199 |
| 2. | 08618 | 7.5% | 2.4%(+5.10)#26 | 3.1%(+4.40)#3,265 |
| 3. | 08629 | 4.0% | 2.4%(+1.60)#77 | 3.1%(+0.900)#8,206 |
| 4. | 08620 | 3.9% | 2.4%(+1.50)#79 | 3.1%(+0.800)#8,475 |
| 5. | 08638 | 3.6% | 2.4%(+1.20)#88 | 3.1%(+0.500)#9,262 |
| 6. | 08609 | 2.3% | 2.4%(-0.100)#164 | 3.1%(-0.800)#14,047 |
| 7. | 08610 | 1.5% | 2.4%(-0.900)#232 | 3.1%(-1.60)#17,717 |
| 8. | 08619 | 1.4% | 2.4%(-1.00)#252 | 3.1%(-1.70)#18,281 |
| 9. | 08690 | 1.3% | 2.4%(-1.10)#272 | 3.1%(-1.80)#18,810 |
| 10. | 08628 | 0.60% | 2.4%(-1.80)#394 | 3.1%(-2.50)#22,309 |
1
Common Questions
What are the Top 10 Zip Codes with the Highest Percentage of Families with Income Below $10,000 in Trenton, NJ?
Top 10 Zip Codes with the Highest Percentage of Families with Income Below $10,000 in Trenton, NJ are:
What zip code has the Highest Percentage of Families with Income Below $10,000 in Trenton, NJ?
08611 has the Highest Percentage of Families with Income Below $10,000 in Trenton, NJ with 7.6%.
What is the Percentage of Families with Income Below $10,000 in Trenton, NJ?
Percentage of Families with Income Below $10,000 in Trenton is 7.9%.
What is the Percentage of Families with Income Below $10,000 in New Jersey?
Percentage of Families with Income Below $10,000 in New Jersey is 2.4%.
What is the Percentage of Families with Income Below $10,000 in the United States?
Percentage of Families with Income Below $10,000 in the United States is 3.1%.