Zip Codes with the Highest Percentage of Population Employed in Agriculture, Fishing & Hunting in Brick, NJ
RELATED REPORTS & OPTIONS
Agriculture, Fishing & Hunting
Brick
Compare Zip Codes
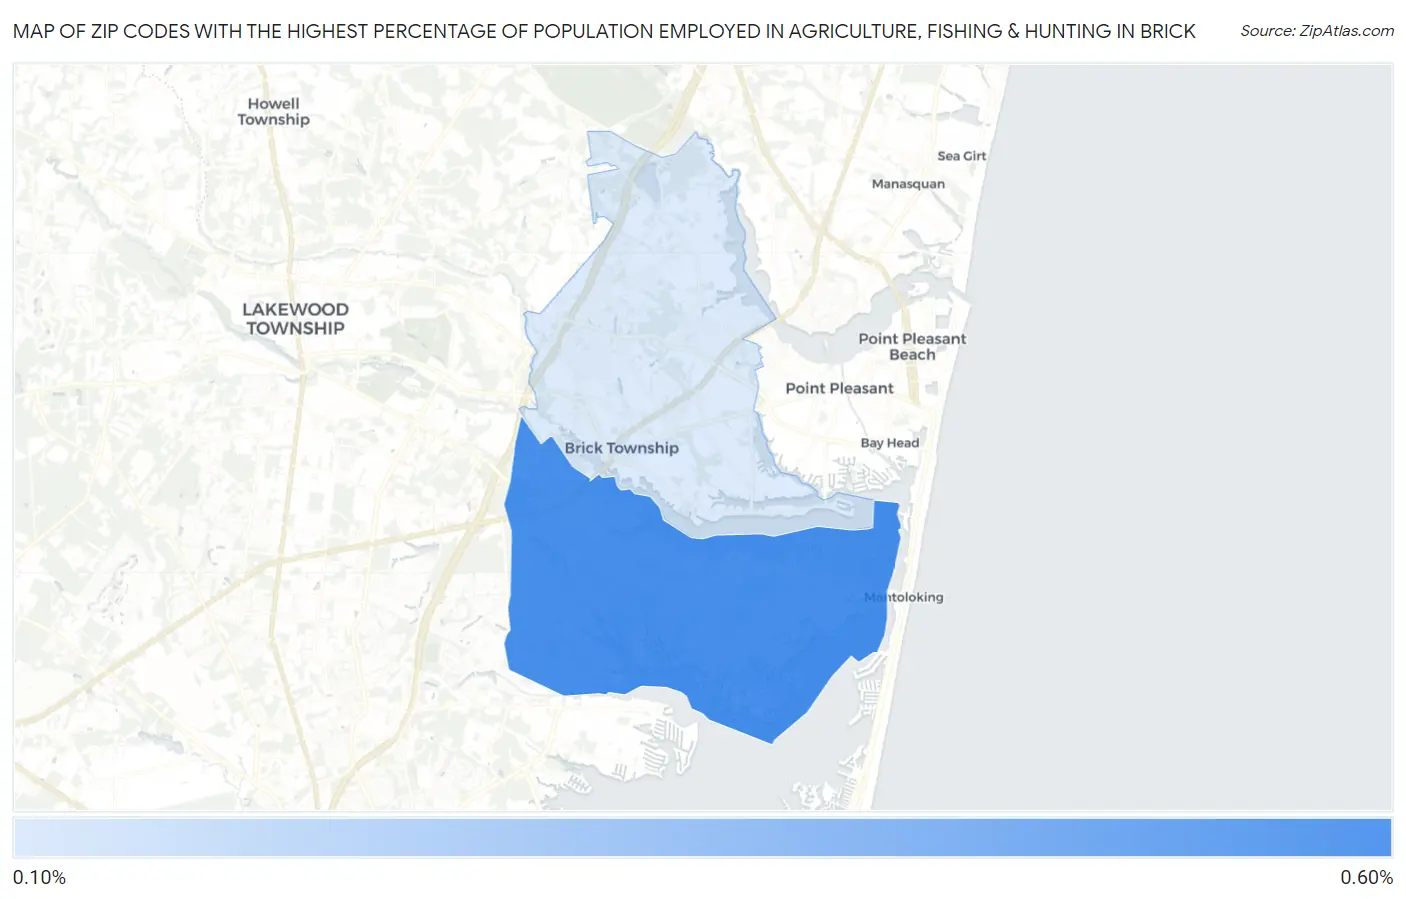
Map of Zip Codes with the Highest Percentage of Population Employed in Agriculture, Fishing & Hunting in Brick
0.0%
0.60%
Zip Codes with the Highest Percentage of Population Employed in Agriculture, Fishing & Hunting in Brick, NJ
| Zip Code | % Employed | vs State | vs National | |
| 1. | 08723 | 0.51% | 0.26%(+0.245)#111 | 1.2%(-0.691)#19,206 |
| 2. | 08724 | 0.12% | 0.26%(-0.139)#249 | 1.2%(-1.08)#23,360 |
1
Common Questions
What are the Top Zip Codes with the Highest Percentage of Population Employed in Agriculture, Fishing & Hunting in Brick, NJ?
Top Zip Codes with the Highest Percentage of Population Employed in Agriculture, Fishing & Hunting in Brick, NJ are:
What zip code has the Highest Percentage of Population Employed in Agriculture, Fishing & Hunting in Brick, NJ?
08723 has the Highest Percentage of Population Employed in Agriculture, Fishing & Hunting in Brick, NJ with 0.51%.
What is the Percentage of Population Employed in Agriculture, Fishing & Hunting in New Jersey?
Percentage of Population Employed in Agriculture, Fishing & Hunting in New Jersey is 0.26%.
What is the Percentage of Population Employed in Agriculture, Fishing & Hunting in the United States?
Percentage of Population Employed in Agriculture, Fishing & Hunting in the United States is 1.2%.