Zip Codes with the Highest Percentage of Population Employed in Arts, Entertainment & Recreation in Brick, NJ
RELATED REPORTS & OPTIONS
Arts, Entertainment & Recreation
Brick
Compare Zip Codes
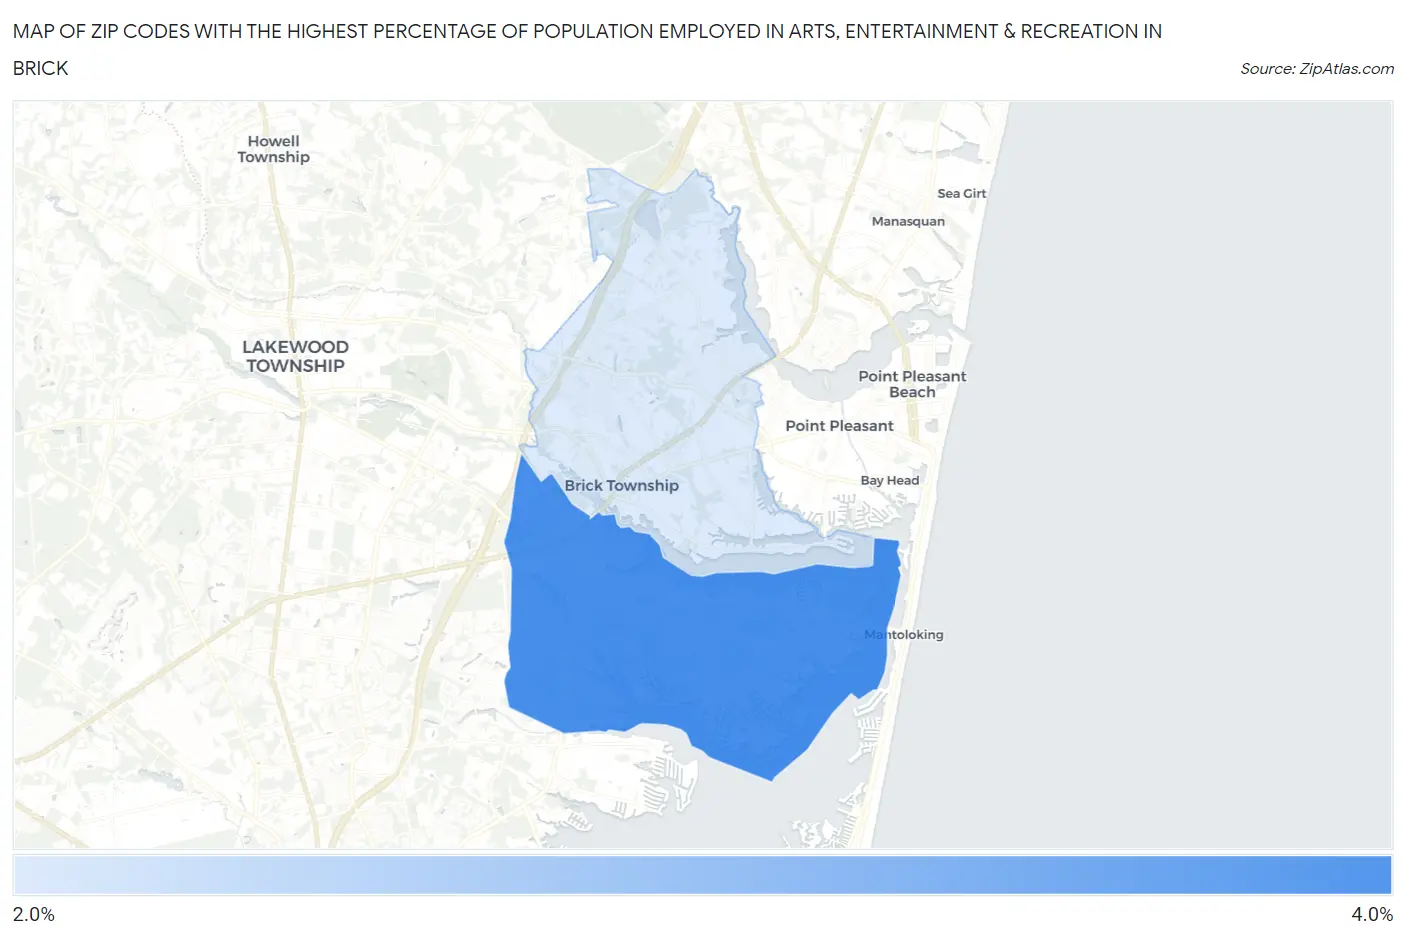
Map of Zip Codes with the Highest Percentage of Population Employed in Arts, Entertainment & Recreation in Brick
0.0%
4.0%
Zip Codes with the Highest Percentage of Population Employed in Arts, Entertainment & Recreation in Brick, NJ
| Zip Code | % Employed | vs State | vs National | |
| 1. | 08723 | 3.2% | 2.1%(+1.15)#99 | 2.1%(+1.14)#4,748 |
| 2. | 08724 | 2.7% | 2.1%(+0.580)#155 | 2.1%(+0.568)#6,563 |
1
Common Questions
What are the Top Zip Codes with the Highest Percentage of Population Employed in Arts, Entertainment & Recreation in Brick, NJ?
Top Zip Codes with the Highest Percentage of Population Employed in Arts, Entertainment & Recreation in Brick, NJ are:
What zip code has the Highest Percentage of Population Employed in Arts, Entertainment & Recreation in Brick, NJ?
08723 has the Highest Percentage of Population Employed in Arts, Entertainment & Recreation in Brick, NJ with 3.2%.
What is the Percentage of Population Employed in Arts, Entertainment & Recreation in New Jersey?
Percentage of Population Employed in Arts, Entertainment & Recreation in New Jersey is 2.1%.
What is the Percentage of Population Employed in Arts, Entertainment & Recreation in the United States?
Percentage of Population Employed in Arts, Entertainment & Recreation in the United States is 2.1%.