Zip Codes with the Highest Percentage of Population Enrolled in Private School in New Hampshire
RELATED REPORTS & OPTIONS
In Private School
New Hampshire
Compare Zip Codes
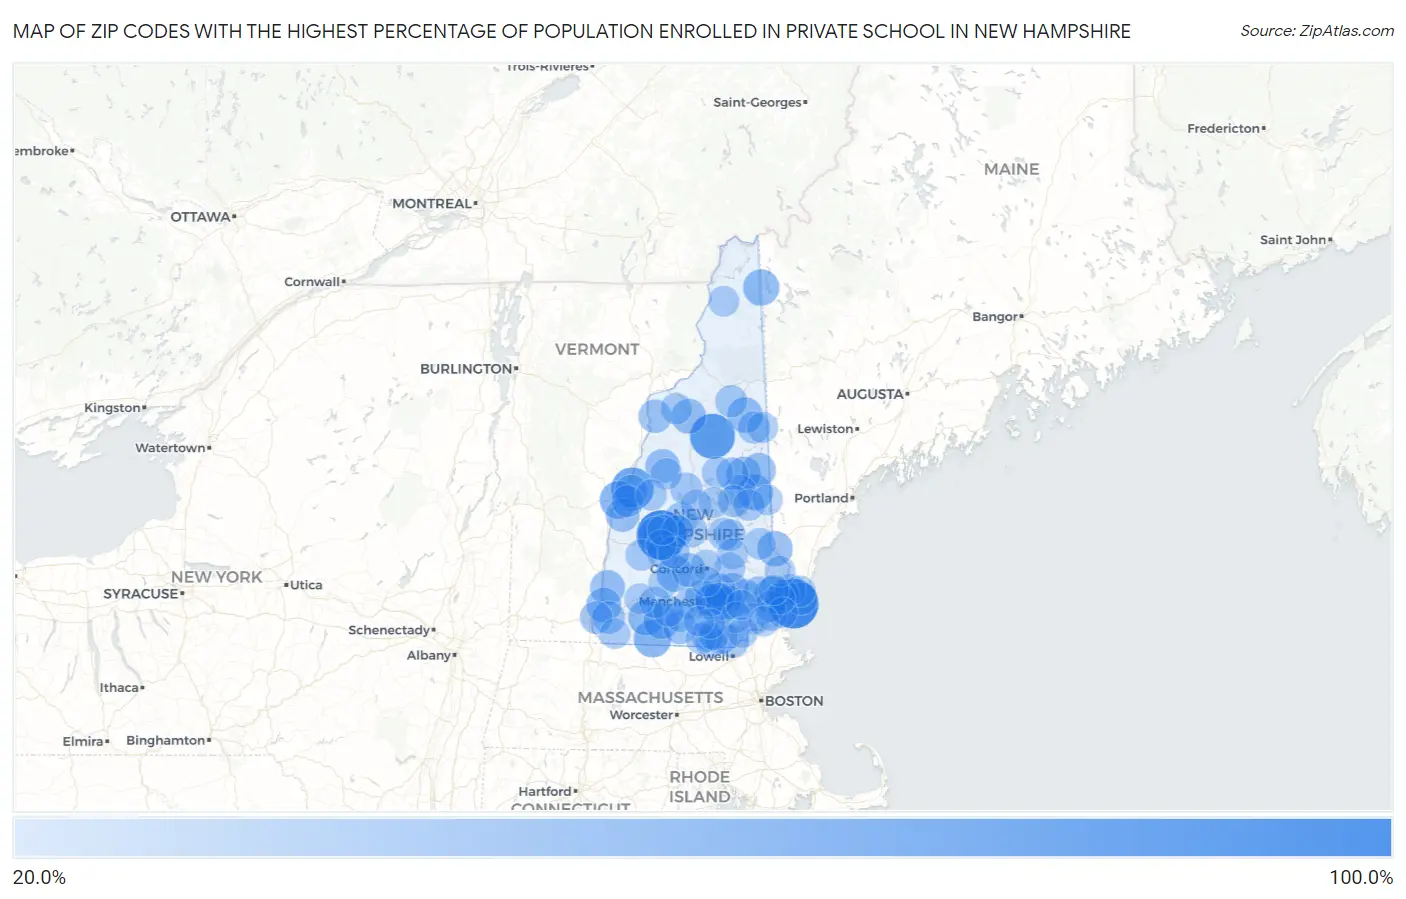
Map of Zip Codes with the Highest Percentage of Population Enrolled in Private School in New Hampshire
0.0%
100.0%
Zip Codes with the Highest Percentage of Population Enrolled in Private School in New Hampshire
| Zip Code | % in Private School | vs State | vs National | |
| 1. | 03871 | 100.0% | 21.8%(+78.2)#1 | 17.3%(+82.7)#41 |
| 2. | 03233 | 100.0% | 21.8%(+78.2)#2 | 17.3%(+82.7)#78 |
| 3. | 03215 | 80.5% | 21.8%(+58.7)#3 | 17.3%(+63.2)#320 |
| 4. | 03755 | 70.3% | 21.8%(+48.5)#4 | 17.3%(+53.0)#451 |
| 5. | 03784 | 51.3% | 21.8%(+29.5)#5 | 17.3%(+34.0)#1,019 |
| 6. | 03101 | 50.1% | 21.8%(+28.3)#6 | 17.3%(+32.8)#1,078 |
| 7. | 03461 | 49.0% | 21.8%(+27.2)#7 | 17.3%(+31.7)#1,146 |
| 8. | 03257 | 47.5% | 21.8%(+25.7)#8 | 17.3%(+30.2)#1,248 |
| 9. | 03856 | 46.8% | 21.8%(+25.0)#9 | 17.3%(+29.5)#1,288 |
| 10. | 03579 | 44.7% | 21.8%(+22.9)#10 | 17.3%(+27.4)#1,423 |
| 11. | 03242 | 43.7% | 21.8%(+21.9)#11 | 17.3%(+26.4)#1,513 |
| 12. | 03444 | 43.7% | 21.8%(+21.9)#12 | 17.3%(+26.4)#1,517 |
| 13. | 03864 | 42.1% | 21.8%(+20.3)#13 | 17.3%(+24.8)#1,658 |
| 14. | 03458 | 41.5% | 21.8%(+19.7)#14 | 17.3%(+24.2)#1,710 |
| 15. | 03846 | 41.4% | 21.8%(+19.6)#15 | 17.3%(+24.1)#1,725 |
| 16. | 03109 | 41.2% | 21.8%(+19.4)#16 | 17.3%(+23.9)#1,740 |
| 17. | 03868 | 41.0% | 21.8%(+19.2)#17 | 17.3%(+23.7)#1,759 |
| 18. | 03608 | 38.6% | 21.8%(+16.8)#18 | 17.3%(+21.3)#2,037 |
| 19. | 03580 | 38.5% | 21.8%(+16.7)#19 | 17.3%(+21.2)#2,043 |
| 20. | 03467 | 38.4% | 21.8%(+16.6)#20 | 17.3%(+21.1)#2,056 |
| 21. | 03045 | 38.2% | 21.8%(+16.4)#21 | 17.3%(+20.9)#2,072 |
| 22. | 03282 | 36.8% | 21.8%(+15.0)#22 | 17.3%(+19.5)#2,259 |
| 23. | 03229 | 35.7% | 21.8%(+13.9)#23 | 17.3%(+18.4)#2,422 |
| 24. | 03890 | 35.7% | 21.8%(+13.9)#24 | 17.3%(+18.4)#2,434 |
| 25. | 03836 | 35.5% | 21.8%(+13.7)#25 | 17.3%(+18.2)#2,463 |
| 26. | 03077 | 34.7% | 21.8%(+12.9)#26 | 17.3%(+17.4)#2,589 |
| 27. | 03034 | 34.1% | 21.8%(+12.3)#27 | 17.3%(+16.8)#2,674 |
| 28. | 03781 | 34.0% | 21.8%(+12.2)#28 | 17.3%(+16.7)#2,707 |
| 29. | 03032 | 33.7% | 21.8%(+11.9)#29 | 17.3%(+16.4)#2,758 |
| 30. | 03106 | 33.2% | 21.8%(+11.4)#30 | 17.3%(+15.9)#2,868 |
| 31. | 03740 | 33.0% | 21.8%(+11.2)#31 | 17.3%(+15.7)#2,909 |
| 32. | 03273 | 32.1% | 21.8%(+10.3)#32 | 17.3%(+14.8)#3,080 |
| 33. | 03076 | 32.0% | 21.8%(+10.2)#33 | 17.3%(+14.7)#3,088 |
| 34. | 03750 | 31.9% | 21.8%(+10.1)#34 | 17.3%(+14.6)#3,126 |
| 35. | 03243 | 31.8% | 21.8%(+10.00)#35 | 17.3%(+14.5)#3,153 |
| 36. | 03086 | 31.5% | 21.8%(+9.70)#36 | 17.3%(+14.2)#3,220 |
| 37. | 03051 | 31.0% | 21.8%(+9.20)#37 | 17.3%(+13.7)#3,334 |
| 38. | 03816 | 30.1% | 21.8%(+8.30)#38 | 17.3%(+12.8)#3,558 |
| 39. | 03883 | 29.8% | 21.8%(+8.00)#39 | 17.3%(+12.5)#3,663 |
| 40. | 03462 | 29.5% | 21.8%(+7.70)#40 | 17.3%(+12.2)#3,746 |
| 41. | 03466 | 29.4% | 21.8%(+7.60)#41 | 17.3%(+12.1)#3,777 |
| 42. | 03235 | 28.8% | 21.8%(+7.00)#42 | 17.3%(+11.5)#3,944 |
| 43. | 03264 | 28.7% | 21.8%(+6.90)#43 | 17.3%(+11.4)#3,969 |
| 44. | 03870 | 28.6% | 21.8%(+6.80)#44 | 17.3%(+11.3)#4,001 |
| 45. | 03216 | 28.5% | 21.8%(+6.70)#45 | 17.3%(+11.2)#4,038 |
| 46. | 03102 | 28.3% | 21.8%(+6.50)#46 | 17.3%(+11.0)#4,078 |
| 47. | 03042 | 28.1% | 21.8%(+6.30)#47 | 17.3%(+10.8)#4,148 |
| 48. | 03845 | 27.7% | 21.8%(+5.90)#48 | 17.3%(+10.4)#4,281 |
| 49. | 03237 | 27.6% | 21.8%(+5.80)#49 | 17.3%(+10.3)#4,302 |
| 50. | 03593 | 27.5% | 21.8%(+5.70)#50 | 17.3%(+10.2)#4,359 |
| 51. | 03766 | 27.3% | 21.8%(+5.50)#51 | 17.3%(+10.00)#4,402 |
| 52. | 03104 | 26.5% | 21.8%(+4.70)#52 | 17.3%(+9.20)#4,676 |
| 53. | 03853 | 26.4% | 21.8%(+4.60)#53 | 17.3%(+9.10)#4,747 |
| 54. | 03278 | 26.2% | 21.8%(+4.40)#54 | 17.3%(+8.90)#4,815 |
| 55. | 03801 | 26.1% | 21.8%(+4.30)#55 | 17.3%(+8.80)#4,839 |
| 56. | 03840 | 25.7% | 21.8%(+3.90)#56 | 17.3%(+8.40)#5,042 |
| 57. | 03586 | 25.6% | 21.8%(+3.80)#57 | 17.3%(+8.30)#5,103 |
| 58. | 03837 | 25.4% | 21.8%(+3.60)#58 | 17.3%(+8.10)#5,194 |
| 59. | 03227 | 25.4% | 21.8%(+3.60)#59 | 17.3%(+8.10)#5,195 |
| 60. | 03835 | 25.3% | 21.8%(+3.50)#60 | 17.3%(+8.00)#5,227 |
| 61. | 03826 | 25.0% | 21.8%(+3.20)#61 | 17.3%(+7.70)#5,358 |
| 62. | 03266 | 25.0% | 21.8%(+3.20)#62 | 17.3%(+7.70)#5,362 |
| 63. | 03752 | 24.8% | 21.8%(+3.00)#63 | 17.3%(+7.50)#5,490 |
| 64. | 03894 | 24.6% | 21.8%(+2.80)#64 | 17.3%(+7.30)#5,556 |
| 65. | 03070 | 24.5% | 21.8%(+2.70)#65 | 17.3%(+7.20)#5,599 |
| 66. | 03082 | 24.5% | 21.8%(+2.70)#66 | 17.3%(+7.20)#5,610 |
| 67. | 03813 | 24.4% | 21.8%(+2.60)#67 | 17.3%(+7.10)#5,655 |
| 68. | 03827 | 24.4% | 21.8%(+2.60)#68 | 17.3%(+7.10)#5,657 |
| 69. | 03449 | 24.4% | 21.8%(+2.60)#69 | 17.3%(+7.10)#5,664 |
| 70. | 03062 | 24.0% | 21.8%(+2.20)#70 | 17.3%(+6.70)#5,841 |
| 71. | 03063 | 24.0% | 21.8%(+2.20)#71 | 17.3%(+6.70)#5,849 |
| 72. | 03741 | 23.9% | 21.8%(+2.10)#72 | 17.3%(+6.60)#5,910 |
| 73. | 03854 | 23.8% | 21.8%(+2.00)#73 | 17.3%(+6.50)#5,979 |
| 74. | 03256 | 23.6% | 21.8%(+1.80)#74 | 17.3%(+6.30)#6,084 |
| 75. | 03038 | 23.5% | 21.8%(+1.70)#75 | 17.3%(+6.20)#6,102 |
| 76. | 03833 | 23.5% | 21.8%(+1.70)#76 | 17.3%(+6.20)#6,111 |
| 77. | 03047 | 23.2% | 21.8%(+1.40)#77 | 17.3%(+5.90)#6,322 |
| 78. | 03049 | 23.0% | 21.8%(+1.20)#78 | 17.3%(+5.70)#6,418 |
| 79. | 03885 | 22.8% | 21.8%(+1.00)#79 | 17.3%(+5.50)#6,521 |
| 80. | 03820 | 22.6% | 21.8%(+0.800)#80 | 17.3%(+5.30)#6,609 |
| 81. | 03576 | 22.6% | 21.8%(+0.800)#81 | 17.3%(+5.30)#6,648 |
| 82. | 03253 | 22.2% | 21.8%(+0.400)#82 | 17.3%(+4.90)#6,856 |
| 83. | 03263 | 22.1% | 21.8%(+0.300)#83 | 17.3%(+4.80)#6,952 |
| 84. | 03457 | 21.9% | 21.8%(+0.100)#84 | 17.3%(+4.60)#7,111 |
| 85. | 03064 | 21.7% | 21.8%(-0.100)#85 | 17.3%(+4.40)#7,193 |
| 86. | 03234 | 21.5% | 21.8%(-0.300)#86 | 17.3%(+4.20)#7,335 |
| 87. | 03079 | 21.4% | 21.8%(-0.400)#87 | 17.3%(+4.10)#7,371 |
| 88. | 03844 | 21.4% | 21.8%(-0.400)#88 | 17.3%(+4.10)#7,402 |
| 89. | 03260 | 21.4% | 21.8%(-0.400)#89 | 17.3%(+4.10)#7,415 |
| 90. | 03301 | 21.2% | 21.8%(-0.600)#90 | 17.3%(+3.90)#7,486 |
| 91. | 03830 | 21.2% | 21.8%(-0.600)#91 | 17.3%(+3.90)#7,538 |
| 92. | 03304 | 20.9% | 21.8%(-0.900)#92 | 17.3%(+3.60)#7,717 |
| 93. | 03244 | 20.8% | 21.8%(-1.000)#93 | 17.3%(+3.50)#7,793 |
| 94. | 03470 | 20.8% | 21.8%(-1.000)#94 | 17.3%(+3.50)#7,800 |
| 95. | 03287 | 20.8% | 21.8%(-1.000)#95 | 17.3%(+3.50)#7,810 |
| 96. | 03857 | 20.7% | 21.8%(-1.10)#96 | 17.3%(+3.40)#7,866 |
| 97. | 03054 | 20.6% | 21.8%(-1.20)#97 | 17.3%(+3.30)#7,913 |
| 98. | 03036 | 20.4% | 21.8%(-1.40)#98 | 17.3%(+3.10)#8,134 |
| 99. | 03858 | 20.4% | 21.8%(-1.40)#99 | 17.3%(+3.10)#8,137 |
| 100. | 03031 | 20.3% | 21.8%(-1.50)#100 | 17.3%(+3.00)#8,188 |
Common Questions
What are the Top 10 Zip Codes with the Highest Percentage of Population Enrolled in Private School in New Hampshire?
Top 10 Zip Codes with the Highest Percentage of Population Enrolled in Private School in New Hampshire are:
What zip code has the Highest Percentage of Population Enrolled in Private School in New Hampshire?
03871 has the Highest Percentage of Population Enrolled in Private School in New Hampshire with 100.0%.
What is the Percentage of Population Enrolled in Private School in the State of New Hampshire?
Percentage of Population Enrolled in Private School in New Hampshire is 21.8%.
What is the Percentage of Population Enrolled in Private School in the United States?
Percentage of Population Enrolled in Private School in the United States is 17.3%.