Zip Codes with the Highest Percentage of Population Employed in Food Preparation & Serving in Kearney, NE
RELATED REPORTS & OPTIONS
Food Preparation & Serving
Kearney
Compare Zip Codes
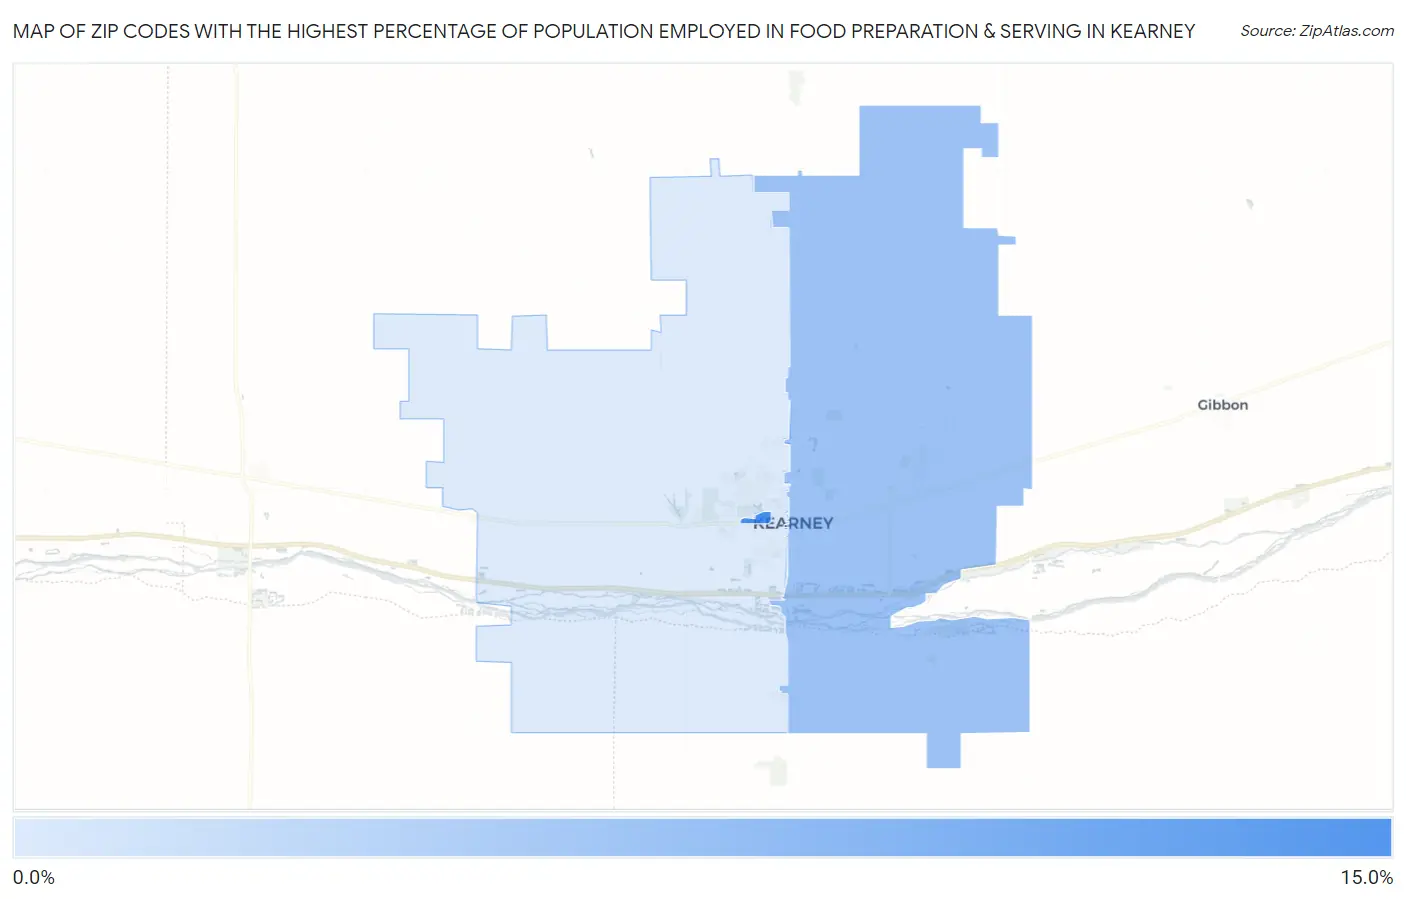
Map of Zip Codes with the Highest Percentage of Population Employed in Food Preparation & Serving in Kearney
0.0%
15.0%
Zip Codes with the Highest Percentage of Population Employed in Food Preparation & Serving in Kearney, NE
| Zip Code | % Employed | vs State | vs National | |
| 1. | 68849 | 11.0% | 5.1%(+5.88)#22 | 5.3%(+5.67)#2,073 |
| 2. | 68847 | 7.6% | 5.1%(+2.56)#74 | 5.3%(+2.35)#5,321 |
| 3. | 68845 | 5.0% | 5.1%(-0.114)#170 | 5.3%(-0.323)#13,094 |
1
Common Questions
What are the Top Zip Codes with the Highest Percentage of Population Employed in Food Preparation & Serving in Kearney, NE?
Top Zip Codes with the Highest Percentage of Population Employed in Food Preparation & Serving in Kearney, NE are:
What zip code has the Highest Percentage of Population Employed in Food Preparation & Serving in Kearney, NE?
68849 has the Highest Percentage of Population Employed in Food Preparation & Serving in Kearney, NE with 11.0%.
What is the Percentage of Population Employed in Food Preparation & Serving in Kearney, NE?
Percentage of Population Employed in Food Preparation & Serving in Kearney is 6.7%.
What is the Percentage of Population Employed in Food Preparation & Serving in Nebraska?
Percentage of Population Employed in Food Preparation & Serving in Nebraska is 5.1%.
What is the Percentage of Population Employed in Food Preparation & Serving in the United States?
Percentage of Population Employed in Food Preparation & Serving in the United States is 5.3%.