Zip Codes with the Highest Percentage of Population with a Degree in Liberal Arts and History in Kearney, NE
RELATED REPORTS & OPTIONS
Liberal Arts and History
Kearney
Compare Zip Codes
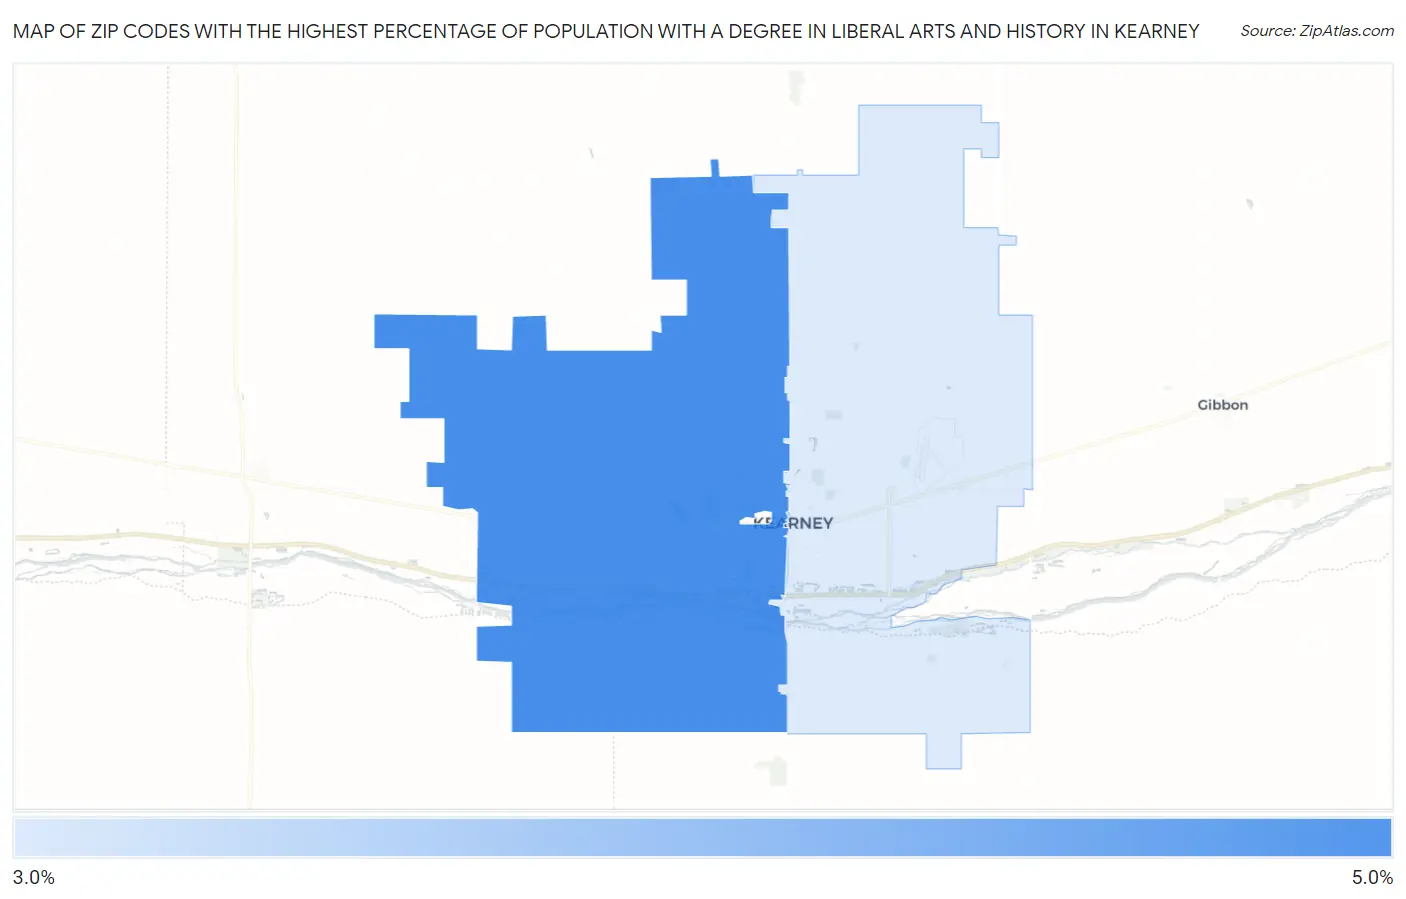
Map of Zip Codes with the Highest Percentage of Population with a Degree in Liberal Arts and History in Kearney
0.0%
5.0%
Zip Codes with the Highest Percentage of Population with a Degree in Liberal Arts and History in Kearney, NE
| Zip Code | % Graduates | vs State | vs National | |
| 1. | 68845 | 4.2% | 4.0%(+0.190)#160 | 4.9%(-0.709)#14,169 |
| 2. | 68847 | 3.0% | 4.0%(-0.965)#227 | 4.9%(-1.86)#18,332 |
1
Common Questions
What are the Top Zip Codes with the Highest Percentage of Population with a Degree in Liberal Arts and History in Kearney, NE?
Top Zip Codes with the Highest Percentage of Population with a Degree in Liberal Arts and History in Kearney, NE are:
What zip code has the Highest Percentage of Population with a Degree in Liberal Arts and History in Kearney, NE?
68845 has the Highest Percentage of Population with a Degree in Liberal Arts and History in Kearney, NE with 4.2%.
What is the Percentage of Population with a Degree in Liberal Arts and History in Kearney, NE?
Percentage of Population with a Degree in Liberal Arts and History in Kearney is 3.8%.
What is the Percentage of Population with a Degree in Liberal Arts and History in Nebraska?
Percentage of Population with a Degree in Liberal Arts and History in Nebraska is 4.0%.
What is the Percentage of Population with a Degree in Liberal Arts and History in the United States?
Percentage of Population with a Degree in Liberal Arts and History in the United States is 4.9%.