Zip Codes with the Highest Percentage of Households Without a Vehicle in Wilson, NC
RELATED REPORTS & OPTIONS
Households without a Cars
Wilson
Compare Zip Codes
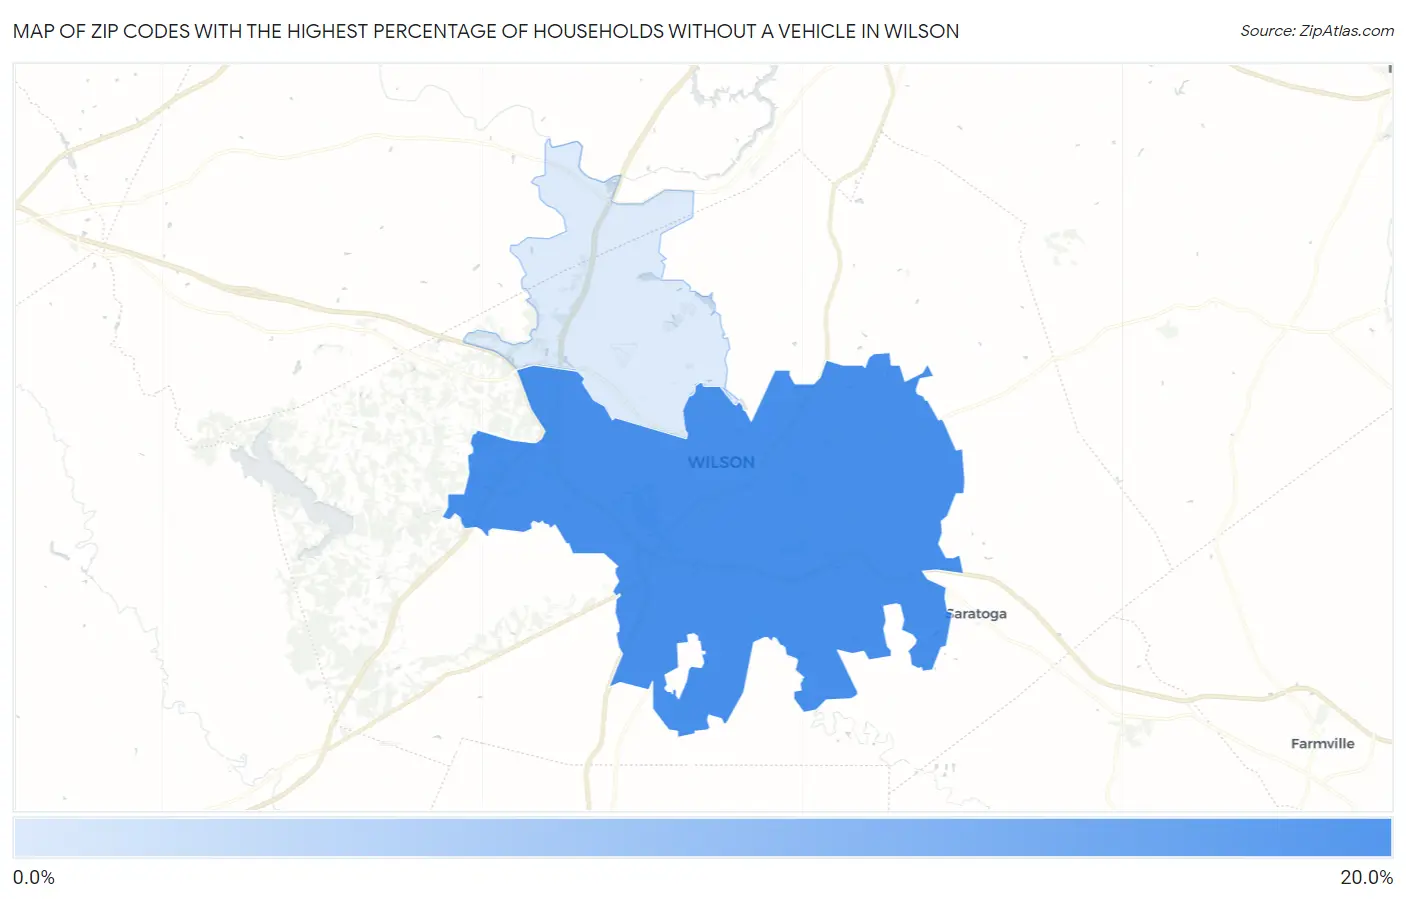
Map of Zip Codes with the Highest Percentage of Households Without a Vehicle in Wilson
0.0%
20.0%
Zip Codes with the Highest Percentage of Households Without a Vehicle in Wilson, NC
| Zip Code | Housholds Without a Car | vs State | vs National | |
| 1. | 27893 | 15.2% | 5.4%(+9.80)#28 | 8.3%(+6.90)#2,323 |
| 2. | 27896 | 2.0% | 5.4%(-3.40)#583 | 8.3%(-6.30)#22,464 |
1
Common Questions
What are the Top Zip Codes with the Highest Percentage of Households Without a Vehicle in Wilson, NC?
Top Zip Codes with the Highest Percentage of Households Without a Vehicle in Wilson, NC are:
What zip code has the Highest Percentage of Households Without a Vehicle in Wilson, NC?
27893 has the Highest Percentage of Households Without a Vehicle in Wilson, NC with 15.2%.
What is the Percentage of Households Without a Vehicle in Wilson, NC?
Percentage of Households Without a Vehicle in Wilson is 11.8%.
What is the Percentage of Households Without a Vehicle in North Carolina?
Percentage of Households Without a Vehicle in North Carolina is 5.4%.
What is the Percentage of Households Without a Vehicle in the United States?
Percentage of Households Without a Vehicle in the United States is 8.3%.